ARE FANGS GOING TO BREAKDOWN SOON?
RESEARCH HIGHLIGHTS:
- FANG Index may begin to peak/top as RSI Divergence pattern sets up.
- Dow Theory trend divergence confirmation suggests the end of the “Excess Rally” is near.
- The VIX moving higher suggests greater concerns of increased volatility.
- Dow Jones Utility Index moving lower on increased volume may be the key in a multiple-pattern set up that will confirm larger market trends.
For some context into today’s research article, please review our recent Dow Theory Trending article from last week. We believe the divergent trend between the Dow Jones Industrial Average, the Dow Jones Transport Index, and the Dow Jones Utilities are keys to understanding the current market setup. Today, the Utilities are moving lower with moderately increased volume while the $INDU and $TRAN are both moving higher. We strongly believe we are very near to a peak in the US stock markets based on Dow Theory and the divergent trends between these three indexes.
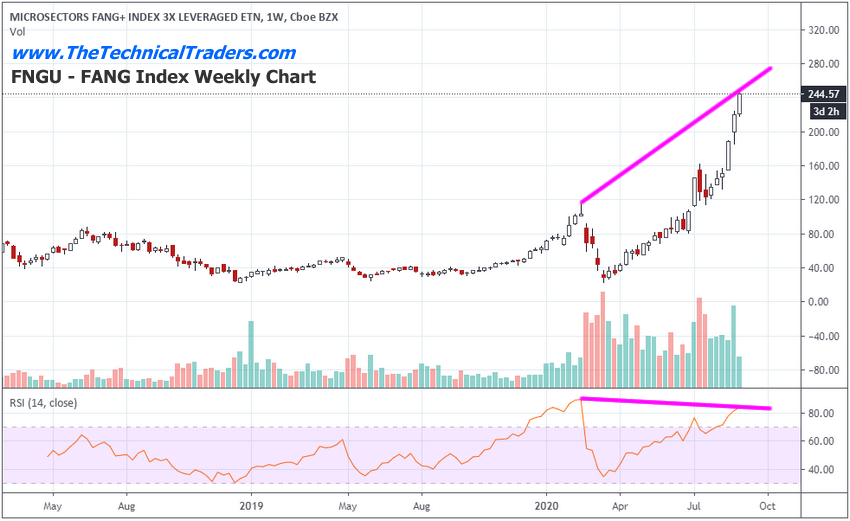
ARE FANGS GOING TO BREAKDOWN OVER THE NEXT 4 TO 10+ DAYS?
A secondary pattern we are watching closely is the FANG Index Weekly Chart, below. This simple RSI Divergence pattern setup suggests a peak may also be near for the rally in FANG/Technology. Whenever a strong upward price trend exists that fails to deliver a new RSI high level, this is called “technical divergence”. At this point in time, we believe the alignment between the Dow Theory Trend divergence in association with the FANG RSI divergence may be more than a coincidence – it may be tied to the end of an overall “excess rally”.
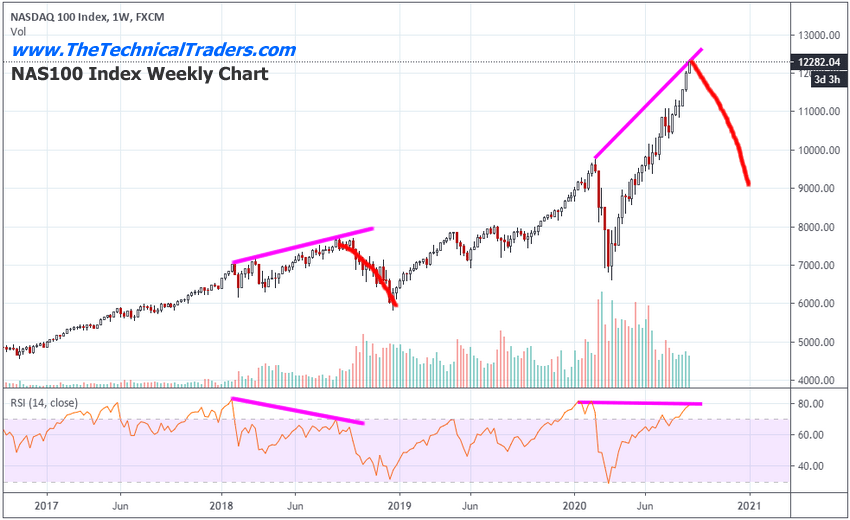
In the following NASDAQ 100 (NAS100) Index weekly chart, we have highlighted past RSI divergence patterns (Tops) to help illustrate how RSI Technical Divergence works. Obviously, we would need to see a breakdown in the upward price trend within the next 5 to 7+ days to better confirm this technical pattern, but the downside move in the Dow Jones Utility Index helps to confirm that the upward price rally in the US stock market is nearing what may become a major peak/top. If our analysis is correct, traders should begin to act to aggressively protect open long positions and watch the Dow Jones Utilities and the VIX for signs of increased risk.
Sometimes these subtle technical patterns align across multiple symbols/instruments to create a much larger pattern. We don’t have any technical confirmation of this setup yet, other than the Dow Jones Utilities falling on increased volume. Our researchers have issued multiple warnings that a peak/top or Head-and-Shoulders pattern appears to be setting up across multiple symbols. We believe traders need to stay very cautious right now. Ultimately, this close to a US presidential election and nearing the end of Q3, we would expect some increased volatility in the markets and a potential correction in this upside price rally. Stay prepared.
Isn’t it time you learned how I can help you better understand technical analysis as well as find and execute better trades? If you look back at past research, you will see that my incredible team and our proprietary technical analysis tools have shown you what to from the markets in the future. Do you want to learn how to profit from these expected huge moves? If so, sign up for my Active ETF Swing Trade Signals today!
If you have a buy-and-hold or retirement account and are looking for long-term technical signals for when to buy and sell equities, bonds, precious metals, or sit in cash then be sure to subscribe to my Passive Long-Term ETF Investing Signals to stay ahead of the market!
NOTICE AND DISCLAIMER: Our free research does not constitute a trade recommendation or solicitation for our readers to take any action regarding this research. It is provided for educational purposes only. Read our FULL DISCLAIMER here and visit www.thetechnicaltraders.com to learn how to take advantage of our members-only research and trading signals.

