Newmont Reports 2020 Mineral Reserves of 94 Million Gold Ounces Replacing 80 Percent of Depletion
DENVER–(BUSINESS WIRE)–Newmont Corporation (NYSE: NEM, TSX: NGT) reported gold Mineral Reserves (reserves) of 94.2 million attributable ounces for 2020 as compared to the Company’s adjusted1 95.7 million ounces at the end of 2019. Newmont exceeded its 2020 conversion target by replacing 80 percent of all depletion and maintaining its industry-leading position with the largest gold reserves.

“As the world’s leading gold company, Newmont has an exceptional history of exploration success and a track record of consistently delivering on our commitments,” said Tom Palmer, President and Chief Executive Officer. “In 2020, we added 6 million ounces of gold reserves overcoming the challenges of an unprecedented year. Newmont’s ability to replace reserves is underpinned by our disciplined operating model and world-class portfolio which will support stable production for decades to come.”
KEY HIGHLIGHTS AND DIFFERENTIATORS:
- Industry’s largest gold Mineral Reserves of 94.2 million ounces
- Over 90 percent of gold reserves in top-tier jurisdictions
- Addition of 6 million ounces in 2020, approximately 5 million ounces added through drilling
- Gold reserve life at operating sites of >10 years underpinned by a strong base at Boddington, Tanami, Ahafo, Yanacocha, Peñasquito, and Nevada Gold Mines (NGM), and further enhanced from our seven other operating mines and equity ownership in Pueblo Viejo
- Significant gold reserves per share with 117 ounces per 1,000 shares, highest in the industry
- Measured & Indicated gold Mineral Resources of 69.6 million ounces; Inferred of 31.6 million ounces
- Significant exposure to copper with 6.9 million tonnes in reserves, 8.0 million tonnes in Measured & Indicated resources and 3.9 million tonnes in Inferred resources
- Additional exposure to silver, zinc, and lead mainly at Peñasquito
PERCENTAGE OF GOLD RESERVES BY JURISDICTION
Newmont’s reserve base is a key differentiator with over 90 percent of gold reserves located in top-tier jurisdictions, an operating reserve life of more than 10 years and average reserve grade of 1.03 grams per tonne. In addition, Newmont has substantial exposure to other metals, with nearly 65 million gold equivalent ounces2 from copper, silver, zinc, lead and molybdenum.
| PROVEN AND PROBABLE GOLD RESERVES3 | |||
| In millions of ounces | |||
| 2019 Gold Reserves |
95.7 |
|
|
| Additions |
4.9 |
|
|
| Net Revisions |
1.1 |
|
|
| Depletion |
(7.5 |
) |
|
| 2020 Gold Reserves |
94.2 |
|
|
For 2020, Newmont reported 94.2 million ounces of gold Mineral Reserves slightly lower than prior year total of 95.7 million ounces after adjusting for the KCGM and Red Lake divestments. Depletion of 7.5 million ounces was largely replaced by additions before revisions of 4.9 million ounces and net revisions of 1.1 million ounces primarily from mine plan improvements.
Additions before revisions of 4.9 million ounces through exploration met the Company’s target despite challenges created by the pandemic with travel restrictions and additional safety protocols. Notable reserve additions for the year from Newmont’s operating sites included:
- Ahafo added 0.8 million ounces primarily from drilling at Subika Underground
- Tanami added 0.6 million ounces from additional drilling at Auron and Federation
- Merian added 0.6 million equity ounces primarily through drilling at the Merian 2 Open Pit
- Nevada Gold Mines added 0.8 million equity ounces and Pueblo Viejo added 0.7 million equity ounces
Favorable net revisions include 1.7 million ounces at Boddington due to the conversion of a layback in the North Open Pit from resource to reserve, partially offset by net negative revision at NGM of 0.4 million ounces and revisions at Ahafo, Cripple Creek & Victor (CC&V), and Musselwhite from mine model and design updates.
Newmont has continued to make progress at recently acquired sites, demonstrating the Company’s ability to improve operational performance and position operations for future growth through its proven operating model and disciplined technical standards. Highlights from select sites in 2020 net of revisions included:
- Éléonore replaced depletion with reserves of 1.3 million ounces, as a result of positive drilling results along with cost improvements from Newmont’s Full Potential program
- Porcupine more than offset depletion, with reserves of 3 million ounces largely due to progressing study work at the Pamour pit and nearly replacing depletion at the Borden Underground
- Cerro Negro replaced depletion with reserves of 2.6 million ounces by advancing infill drilling at underground mines
Newmont’s 38.5 percent interest in NGM represented 17.4 million equity ounces of gold reserves at year end, as compared to 18.6 million equity ounces at the end of 2019. PV represented 4.1 million equity ounces in gold reserves at year end as compared to 3.8 million equity ounces at the end of 2019, representing Newmont’s 40 percent interest.
Gold reserve grade held constant at 1.03 grams per tonne compared to the prior year.
|
MEASURED & INDICATED GOLD RESOURCES4 |
INFERRED GOLD RESOURCES4 | |||||||
| In millions of ounces | In millions of ounces | |||||||
| 2019 Gold Resources |
74.1 |
|
2019 Gold Resources |
29.4 |
|
|||
| Additions |
3.4 |
|
Additions |
3.5 |
|
|||
| Acquisitions |
1.2 |
|
Acquisitions |
0.3 |
|
|||
| Net Revisions |
(1.8 |
) |
Net Revisions |
(0.2 |
) |
|||
| Conversions |
(7.3 |
) |
Conversions |
(1.4 |
) |
|||
| 2020 Gold Resources |
69.6 |
|
2020 Gold Resources |
31.6 |
|
|||
In 2020, Newmont reported Measured and Indicated gold Mineral Resources of 69.6 million ounces as compared to 74.1 million ounces in the prior year. Inferred gold Mineral Resources totaled 31.6 million ounces as compared to 29.4 million ounces in 2019. The impact from the pandemic required Newmont to prioritize drilling programs in existing operations due to travel restrictions and impacted our ability to progress greenfield resources.
Measured and Indicated Gold Mineral Resources added through exploration programs were 3.4 million ounces and included notable additions before revisions at Yanacocha of 0.5 million equity ounces and 0.3 million ounces at Ahafo South, Porcupine and Éléonore. Additionally, NGM added 0.9 million equity ounces.
Measured and Indicated Gold Mineral Resources reported negative revisions of 1.8 million ounces mainly driven by Porcupine of 2.4 million ounces primarily due to updated study work at the Dome and Pamour West Open Pits partially offset by positive revisions in North and South America.
Inferred Gold Mineral Resources added through exploration programs were 3.5 million ounces and included notable additions at Tanami of 1.4 million ounces, Merian of 0.5 million equity ounces, Cerro Negro of 0.5 million ounces and Ahafo South of 0.4 million ounces. Inferred Gold Mineral Resources had negative net revisions of 0.2 million ounces.
The formation of the MARA project at Agua Rica increased Measured and Indicated gold Mineral Resources by 1.2 million ounces and Inferred Gold Resources by 0.4 million ounces.
Newmont’s Measured and Indicated gold Mineral Resource grade decreased to 0.65 grams per tonne compared to 0.70 grams per tonne in the prior year largely from higher grade being converted to reserves. Inferred gold Mineral Resource grade of 0.65 grams per tonne increased compared with 0.63 grams per tonne from 2019.
OTHER METALS
Newmont’s base metal reserves were largely stable from 2019. Copper reserves increased slightly to 6.9 million tonnes from 6.8 million tonnes in 2019. Copper resources increased to 8.0 million tonnes of Measured & Indicated and 3.9 million tonnes of Inferred from 6.8 million tonnes of Measured and Indicated and 3.5 million tonnes of Inferred due to additions at Newmont’s Nueva Union joint venture and the formation of the Agua Rica joint venture.
Silver reserves decreased from 652 million ounces to 613 million ounces, largely due to depletion and the temporary suspension of exploration activities at Peñasquito from COVID-19 restrictions. Measured and Indicated silver resources were 482 million ounces and Inferred were 204 million ounces with revisions at Peñasquito, offsetting additions from Nueva Union and the MARA project at Agua Rica.
Lead reserves decreased to 1.3 million tonnes from 1.5 million, zinc reserves also decreased to 3.1 million tonnes from 3.4 million tonnes. In both cases the reduction was primarily due to depletion and the suspension of exploration activities at Peñasquito from COVID-19 restrictions. Measured & Indicated zinc resources decreased to 1.7 million tonnes from 1.9 million tonnes and Inferred zinc resources decreased to 0.8 million tonnes from 1.0 million tonnes. Measured & Indicated lead resources remained consistent at 0.8 million tonnes and Inferred lead resources decreased to 0.4 million tonnes from 0.5 million tonnes.
EXPLORATION OUTLOOK
Newmont’s total exploration expenditure is expected to be approximately $215 million in 2021 with 80 percent of total exploration investment dedicated to near-mine expansion programs and the remaining 20 percent allocated to the advancement of greenfield projects and innovation programs.
Additionally, Newmont’s share of exploration investment for its non-managed joint ventures will total approximately $35 million.
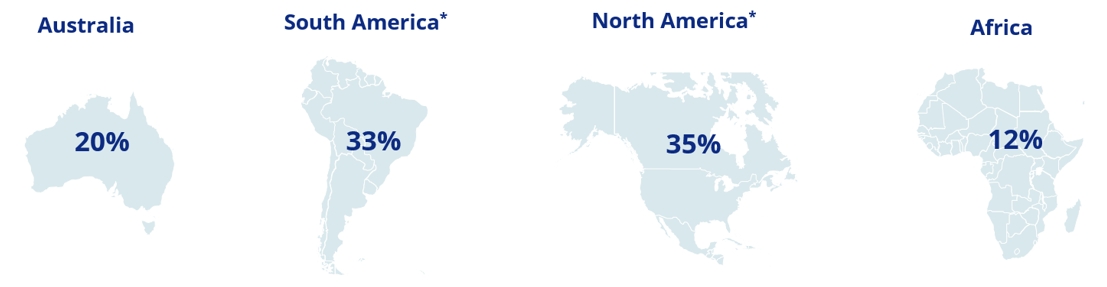
Geographically, the Company expects to invest approximately 28 percent in North America, 25 percent in South America, 20 percent in Australia and the remainder in Africa and other locations.
GOLD RESERVE SENSITIVITY
A $100 increase in gold price would result in an approximate four percent increase in gold reserves while a $100 decrease in gold price would result in an approximate seven percent decrease in gold reserves. These sensitivities assume an oil price of $50 per barrel (WTI), Australian dollar exchange rate of $0.75 and Canadian dollar exchange rate of $0.77.
For additional details on Newmont’s reported Gold, Copper, Silver, Zinc, Lead and Molybdenum Mineral Reserves and Mineral Resources, please refer to the tables at the end of this release.
KEY RESERVE AND RESOURCE ASSUMPTIONS:
|
|
Years Ended December 31, |
|||
|
|
2020 |
|
2019 |
|
|
Gold Reserves (US$/oz.) |
$1,200 |
|
$1,200 |
|
|
Gold Resources (US$/oz.) |
$1,400 |
|
$1,400 |
|
|
Copper Reserves (US$/lb.) |
$2.75 |
|
$2.75 |
|
|
Copper Resources (US$/lb.) |
$3.25 |
|
$3.25 |
|
|
Silver Reserves (US$/oz.) |
$17.00 |
|
$16.00 |
|
|
Silver Resources (US$/oz.) |
$20.00 |
|
$20.00 |
|
|
Zinc Reserves (US$/lb.) |
$1.15 |
|
$1.20 |
|
|
Zinc Resources (US$/lb.) |
$1.40 |
|
$1.45 |
|
|
Lead Reserves (US$/lb.) |
$0.90 |
|
$0.95 |
|
|
Lead Resources (US$/lb.) |
$1.10 |
|
$1.15 |
|
|
Australian Dollar (A$:US$) |
$0.75 |
|
$0.75 |
|
|
Canadian Dollar (C$:US$) |
$0.77 |
|
$0.77 |
|
|
Mexican Peso (M$:US$) |
$19.50 |
|
$19.50 |
|
|
West Texas Intermediate (US$/bbl.) |
$50 |
|
$60 |
|
|
1 |
Newmont’s reported 2019 gold Mineral Reserves of 100.2 million ounces, gold Measured and Indicated Mineral Resources of 76.7 million ounces, and gold Inferred Mineral Resources of 31.3 million ounces were adjusted for the sale of Red Lake and the Company’s 50 percent interest in Kalgoorlie Consolidated Gold Mines (KCGM), which occurred during first quarter of 2020. Combined, these sites represented approximately 4.5 million ounces of gold Mineral Reserves and 2.6 million ounces of Measured and Indicated Mineral Resources (resources), bringing Newmont’s adjusted 2019 gold Mineral Reserves to 95.7 million ounces and gold Measured and Indicated Mineral Resources to 74.1 million ounces. Newmont’s adjusted 2019 Inferred gold Mineral Resources were 29.4 million ounces, after removal of 1.9 million ounces for the sale of Red Lake and KCGM. |
|
|
2
|
|
Gold Equivalent Ounces calculated using Mineral Reserve pricing as shown in the Key Reserves and Resource Assumptions table above and metallurgical recoveries for each metal on a site by site basis. |
|
3 |
2019 Gold Reserves are adjusted for divestiture of Red Lake and KCGM. |
|
|
4 |
2019 Measured & Indicated Gold Resource and 2019 Inferred Gold Resource adjusted for divestiture of Red Lake and KCGM. |
|
RESERVE AND RESOURCE TABLES
Proven and Probable reserves are based on extensive drilling, sampling, mine modeling and metallurgical testing from which we determine economic feasibility. Newmont’s metal price assumptions follow SEC guidance not to exceed a three year trailing average. The price sensitivity of reserves depends upon several factors including grade, metallurgical recovery, operating cost, waste-to-ore ratio and ore type. Metallurgical recovery rates vary depending on the metallurgical properties of each deposit and the production process used. The reserve tables included in this release list the average metallurgical recovery rate for each deposit, which takes into account the assumed processing methods. The cut-off grade, or lowest grade of material considered economic to process, varies with material type, price, metallurgical recoveries, operating costs and co- or by-product credits. The Proven and Probable reserve figures presented herein are estimates based on information available at the time of calculation. No assurance can be given that the indicated levels of recovery of gold, silver, copper, lead, zinc and molybdenum will be realized. Ounces of gold and silver or tonnes of copper, zinc, lead, or molybdenum included in the Proven and Probable reserves are those contained prior to losses during metallurgical treatment. Reserve estimates may require revision based on actual production. Market fluctuations in the price of gold, silver, copper, zinc, lead, or molybdenum, as well as increased production costs or reduced metallurgical recovery rates, could render certain Proven and Probable reserves containing relatively lower grades of mineralization uneconomic to exploit and might result in a reduction of reserves.
The Measured, Indicated, and Inferred resource figures presented herein are estimates based on information available at the time of calculation and are exclusive of reserves. A “Mineral Resource” is a concentration or occurrence of solid material of economic interest in or on the Earth’s crust in such form, grade, or quality and quantity that there are reasonable prospects for eventual economic extraction. The location, quantity, grade or quality, continuity and other geological characteristics of a Mineral Resource are known, estimated or interpreted from specific geological evidence and knowledge, including sampling. Mineral Resources are sub-divided, in order of increasing geological confidence, into Inferred, Indicated and Measured categories. Ounces of gold and silver or tonnes of copper, zinc, lead, and molybdenum included in the Measured, Indicated and Inferred resources are those contained prior to losses during metallurgical treatment. Market fluctuations in the price of gold, silver, copper, zinc, lead and molybdenum, as well as increased production costs or reduced metallurgical recovery rates, could change future estimates of resources. Please refer to the reserves and resources cautionary statement at the end of the release.
We publish reserves annually, and will recalculate reserves at December 31, 2021, taking into account metal prices, changes, if any, to future production and capital costs, divestments and depletion as well as any acquisitions and additions during 2021. Reserve disclosures as at December 31, 2021 will be presented in the Annual Report on Form 10-K, expected to be filed in February 2022, in accordance with the new Regulation S-K 1300 requirements of the SEC; whereas reserve disclosures as at December 31, 2020, presented herein, have been prepared in accordance with the SEC’s Industry Guide 7.
|
Attributable Proven, Probable and Combined Gold Reserves (1), Metric Units |
||||||||||||||||||||||||||||||
|
|
December 31, 2020 |
|
December 31, 2019 |
|||||||||||||||||||||||||||
|
|
|
|
|
Proven Reserves |
|
Probable Reserves |
|
Proven and Probable Reserves |
|
|
|
Proven and Probable Reserves |
||||||||||||||||||
|
|
|
Newmont |
|
Tonnage (2) |
|
Grade |
|
Gold (3) |
|
Tonnage (2) |
|
Grade |
|
Gold (3) |
|
Tonnage (2) |
|
Grade |
|
Gold (3) |
|
Metallurgical |
|
Tonnage (2) |
|
Grade |
|
Gold (3) |
||
|
Deposits/Districts |
Share |
|
(x1000 tonnes) |
|
(g/tonne) |
|
(x1000 ozs) |
|
(x1000 tonnes) |
|
(g/tonne) |
|
(x1000 ozs) |
|
(x1000 tonnes) |
|
(g/tonne) |
|
(x1000 ozs) |
|
Recovery |
|
(x1000 tonnes) |
|
(g/tonne) |
|
(x1000 ozs) |
|||
|
North America |
|
|
|
|
|
|
|
|
|
|
|
|
|
|
||||||||||||||||
|
CC&V Open Pits (4) |
100 |
% |
85,300 |
0.50 |
1,370 |
19,900 |
0.38 |
240 |
105,200 |
0.48 |
1,610 |
62 |
% |
118,500 |
0.50 |
1,910 |
||||||||||||||
|
CC&V Leach Pads (5) |
100 |
% |
— |
|
— |
33,000 |
0.82 |
880 |
33,000 |
0.82 |
880 |
57 |
% |
31,600 |
0.88 |
890 |
||||||||||||||
|
Total CC&V, Colorado |
|
85,300 |
0.50 |
1,370 |
52,900 |
0.66 |
1,120 |
138,200 |
0.56 |
2,490 |
61 |
% |
150,100 |
0.58 |
2,800 |
|||||||||||||||
|
Red Lake, Canada (6) |
100 |
% |
— |
|
— |
— |
|
— |
— |
|
— |
— |
% |
4,600 |
8.68 |
1,300 |
||||||||||||||
|
Musselwhite, Canada (7) |
100 |
% |
1,900 |
6.24 |
380 |
7,000 |
6.25 |
1,410 |
8,900 |
6.25 |
1,790 |
95 |
% |
9,900 |
6.52 |
2,090 |
||||||||||||||
|
Porcupine Underground (8) |
100 |
% |
2,200 |
7.86 |
550 |
2,800 |
6.14 |
550 |
5,000 |
6.90 |
1,100 |
91 |
% |
4,900 |
7.33 |
1,150 |
||||||||||||||
|
Porcupine Open Pit (9) |
100 |
% |
8,200 |
1.53 |
410 |
34,100 |
1.40 |
1,540 |
42,300 |
1.43 |
1,950 |
94 |
% |
44,600 |
1.16 |
1,670 |
||||||||||||||
|
Total Porcupine, Canada |
|
10,400 |
2.87 |
960 |
36,900 |
1.76 |
2,090 |
47,300 |
2.01 |
3,050 |
93 |
% |
49,500 |
1.77 |
2,820 |
|||||||||||||||
|
Éléonore, Canada (10) |
100 |
% |
1,400 |
5.75 |
260 |
6,400 |
4.84 |
1,000 |
7,800 |
5.00 |
1,260 |
93 |
% |
7,400 |
5.31 |
1,280 |
||||||||||||||
|
Peñasquito Open Pit |
100 |
% |
100,100 |
0.64 |
2,060 |
248,100 |
0.58 |
4,620 |
348,200 |
0.60 |
6,680 |
71 |
% |
409,700 |
0.60 |
7,860 |
||||||||||||||
|
Peñasquito Stockpiles |
100 |
% |
11,800 |
0.65 |
250 |
27,800 |
0.19 |
170 |
39,600 |
0.33 |
420 |
53 |
% |
31,800 |
0.22 |
220 |
||||||||||||||
|
Total Peñasquito, Mexico (11) |
|
111,900 |
0.64 |
2,310 |
275,900 |
0.54 |
4,790 |
387,800 |
0.57 |
7,100 |
70 |
% |
441,500 |
0.57 |
8,080 |
|||||||||||||||
|
TOTAL NORTH AMERICA |
|
210,900 |
0.78 |
5,280 |
379,100 |
0.85 |
10,410 |
590,000 |
0.83 |
15,690 |
78 |
% |
663,000 |
0.86 |
18,370 |
|||||||||||||||
|
South America |
|
|
|
|
|
|
|
|
|
|
|
|
|
|
||||||||||||||||
|
Yanacocha Open Pits (12) |
51.35 |
% |
5,800 |
0.64 |
120 |
89,300 |
0.66 |
1,900 |
95,100 |
0.66 |
2,020 |
60 |
% |
107,700 |
0.65 |
2,260 |
||||||||||||||
|
Yanacocha Underground (13) |
51.35 |
% |
— |
|
— |
7,000 |
6.20 |
1,390 |
7,000 |
6.20 |
1,390 |
97 |
% |
6,000 |
6.88 |
1,310 |
||||||||||||||
|
Total Yanacocha, Peru |
|
5,800 |
0.64 |
120 |
96,300 |
1.06 |
3,290 |
102,100 |
1.04 |
3,410 |
75 |
% |
113,700 |
0.98 |
3,570 |
|||||||||||||||
|
Merian, Suriname (14) |
75 |
% |
50,100 |
1.30 |
2,100 |
57,400 |
1.01 |
1,870 |
107,500 |
1.15 |
3,970 |
93 |
% |
87,700 |
1.23 |
3,480 |
||||||||||||||
|
Cerro Negro, Argentina (15) |
100 |
% |
2,400 |
8.35 |
630 |
6,600 |
9.10 |
1,940 |
9,000 |
8.90 |
2,570 |
91 |
% |
8,400 |
9.70 |
2,600 |
||||||||||||||
|
Pueblo Viejo Open Pits |
40 |
% |
9,500 |
2.41 |
730 |
10,100 |
2.27 |
740 |
19,600 |
2.34 |
1,470 |
91 |
% |
12,300 |
2.70 |
1,070 |
||||||||||||||
|
Pueblo Viejo Stockpiles (16) |
40 |
% |
— |
|
— |
35,800 |
2.30 |
2,640 |
35,800 |
2.30 |
2,640 |
89 |
% |
35,300 |
2.41 |
2,740 |
||||||||||||||
|
Total Pueblo Viejo, Dominican Republic(17) |
|
9,500 |
2.41 |
730 |
45,900 |
2.29 |
3,380 |
55,400 |
2.31 |
4,110 |
90 |
% |
47,600 |
2.49 |
3,810 |
|||||||||||||||
|
NuevaUnión, Chile (18) |
50 |
% |
— |
|
— |
341,100 |
0.47 |
5,110 |
341,100 |
0.47 |
5,110 |
66 |
% |
341,100 |
0.47 |
5,150 |
||||||||||||||
|
Norte Abierto, Chile (19) |
50 |
% |
— |
|
— |
598,800 |
0.60 |
11,620 |
598,800 |
0.60 |
11,620 |
74 |
% |
598,800 |
0.60 |
11,620 |
||||||||||||||
|
TOTAL SOUTH AMERICA |
|
67,800 |
1.65 |
3,580 |
1,146,100 |
0.74 |
27,210 |
1,213,900 |
0.79 |
30,790 |
79 |
% |
1,197,300 |
0.79 |
30,230 |
|||||||||||||||
|
Australia |
|
|
|
|
|
|
|
|
|
|
|
|
|
|
||||||||||||||||
|
Boddington Open Pit (20) |
100 |
% |
247,100 |
0.68 |
5,430 |
287,600 |
0.66 |
6,060 |
534,700 |
0.67 |
11,490 |
85 |
% |
481,000 |
0.69 |
10,720 |
||||||||||||||
|
Boddington Stockpiles (16) |
100 |
% |
1,600 |
0.79 |
40 |
84,800 |
0.43 |
1,160 |
86,400 |
0.43 |
1,200 |
78 |
% |
85,300 |
0.44 |
1,210 |
||||||||||||||
|
Total Boddington, Western Australia |
|
248,700 |
0.69 |
5,470 |
372,400 |
0.60 |
7,220 |
621,100 |
0.64 |
12,690 |
85 |
% |
566,300 |
0.65 |
11,930 |
|||||||||||||||
|
Tanami, Northern Territory (21) |
100 |
% |
14,600 |
4.89 |
2,290 |
21,600 |
5.15 |
3,580 |
36,200 |
5.05 |
5,870 |
98 |
% |
33,200 |
5.31 |
5,680 |
||||||||||||||
|
Kalgoorlie Open Pit and Underground |
50 |
% |
— |
|
— |
— |
|
— |
— |
|
— |
— |
% |
24,100 |
2.02 |
1,560 |
||||||||||||||
|
Kalgoorlie Stockpiles |
50 |
% |
— |
|
— |
— |
|
— |
— |
|
— |
— |
% |
65,000 |
0.76 |
1,580 |
||||||||||||||
|
Total Kalgoorlie, Western Australia (22) |
|
— |
|
— |
— |
|
— |
— |
|
— |
— |
% |
89,100 |
1.10 |
3,140 |
|||||||||||||||
|
TOTAL AUSTRALIA |
|
263,300 |
0.92 |
7,760 |
394,000 |
0.85 |
10,800 |
657,300 |
0.88 |
18,560 |
89 |
% |
688,600 |
0.94 |
20,750 |
|||||||||||||||
|
Africa |
|
|
|
|
|
|
|
|
|
|
|
|
|
|
||||||||||||||||
|
Ahafo South Open Pits (23) |
100 |
% |
11,900 |
2.41 |
910 |
38,100 |
1.75 |
2,140 |
50,000 |
1.90 |
3,050 |
90 |
% |
57,200 |
1.90 |
3,490 |
||||||||||||||
|
Ahafo South Underground (24) |
100 |
% |
7,500 |
3.91 |
950 |
9,600 |
3.23 |
990 |
17,100 |
3.53 |
1,940 |
94 |
% |
14,500 |
3.29 |
1,540 |
||||||||||||||
|
Ahafo South Stockpiles (16) |
100 |
% |
36,200 |
0.92 |
1,070 |
— |
|
— |
36,200 |
0.92 |
1,070 |
88 |
% |
38,300 |
0.92 |
1,140 |
||||||||||||||
|
Total Ahafo South, Ghana |
|
55,600 |
1.64 |
2,930 |
47,700 |
2.04 |
3,130 |
103,300 |
1.82 |
6,060 |
91 |
% |
110,000 |
1.74 |
6,170 |
|||||||||||||||
|
Ahafo North, Ghana (25) |
100 |
% |
— |
|
— |
45,100 |
2.40 |
3,480 |
45,100 |
2.40 |
3,480 |
91 |
% |
45,100 |
2.40 |
3,470 |
||||||||||||||
|
Akyem Open Pit (26) |
100 |
% |
17,100 |
1.67 |
920 |
17,100 |
1.73 |
950 |
34,200 |
1.70 |
1,870 |
91 |
% |
38,900 |
1.70 |
2,120 |
||||||||||||||
|
Akyem Stockpiles (16) |
100 |
% |
15,100 |
0.82 |
400 |
— |
|
— |
15,100 |
0.82 |
400 |
90 |
% |
16,400 |
0.88 |
460 |
||||||||||||||
|
Total Akyem, Ghana |
|
32,200 |
1.27 |
1,320 |
17,100 |
1.73 |
950 |
49,300 |
1.43 |
2,270 |
90 |
% |
55,300 |
1.46 |
2,580 |
|||||||||||||||
|
TOTAL AFRICA |
|
87,800 |
1.51 |
4,250 |
109,900 |
2.14 |
7,560 |
197,700 |
1.86 |
11,810 |
91 |
% |
210,400 |
1.81 |
12,220 |
|||||||||||||||
|
Nevada |
|
|
|
|
|
|
|
|
|
|
|
|
|
|
||||||||||||||||
|
NGM Open Pits |
38.5 |
% |
10,500 |
1.68 |
570 |
123,800 |
1.22 |
4,870 |
134,300 |
1.26 |
5,440 |
70 |
% |
151,700 |
1.22 |
5,940 |
||||||||||||||
|
NGM Stockpiles (16) |
38.5 |
% |
33,300 |
2.36 |
2,530 |
— |
|
— |
33,300 |
2.36 |
2,530 |
71 |
% |
37,100 |
2.38 |
2,830 |
||||||||||||||
|
NGM Underground |
38.5 |
% |
15,200 |
10.07 |
4,930 |
14,500 |
9.61 |
4,490 |
29,700 |
9.85 |
9,420 |
88 |
% |
30,300 |
10.14 |
9,830 |
||||||||||||||
|
Total NGM (27) |
|
59,000 |
4.23 |
8,030 |
138,300 |
2.11 |
9,360 |
197,300 |
2.74 |
17,390 |
80 |
% |
219,100 |
2.64 |
18,600 |
|||||||||||||||
|
TOTAL NEVADA |
|
59,000 |
4.23 |
8,030 |
138,300 |
2.11 |
9,360 |
197,300 |
2.74 |
17,390 |
80 |
% |
219,100 |
2.64 |
18,600 |
|||||||||||||||
|
TOTAL NEWMONT |
|
688,800 |
1.31 |
28,900 |
2,167,400 |
0.94 |
65,340 |
2,856,200 |
1.03 |
94,240 |
82 |
% |
2,978,400 |
1.05 |
100,170 |
|||||||||||||||
|
(1) |
See cautionary statement regarding reserves and resources on page 15 hereof. 2020 and 2019 reserves were estimated at a gold price of $1,200 per ounce unless otherwise noted. |
|
|
(2) |
Tonnages include allowances for losses resulting from mining methods. Tonnages are rounded to the nearest 100,000. |
|
|
(3) |
Ounces are estimates of metal contained in ore tonnages and do not include allowances for processing losses. Metallurgical recovery rates represent the estimated amount of metal to be recovered through metallurgical extraction processes. Ounces may not recalculate as they are rounded to the nearest 10,000. |
|
|
(4) |
Cut-off grades utilized in 2020 reserves were as follows: oxide mill material not less than 0.89 gram per tonne and leach material not less than 0.16 gram per tonne. |
|
|
(5) |
Leach pad material is the material on leach pads at the end of the year from which gold remains to be recovered. In-process reserves are reported separately where ounces exceed 100,000 and are greater than 5% of the total site-reported reserves. |
|
|
(6) |
Red Lake was sold during 2020 and classified as held for sale as of December 31, 2019. |
|
|
(7) |
Cut-off grade utilized in 2020 reserves not less than 3.45 gram per tonne. |
|
|
(8) |
Cut-off grade utilized in 2020 reserves not less than 2.50 gram per tonne. |
|
|
(9) |
Cut-off grade utilized in 2020 reserves not less than 0.44 gram per tonne. |
|
|
(10) |
Cut-off grade utilized in 2020 reserves not less than 4.50 gram per tonne. |
|
|
(11) |
Gold cut-off grade varies with level of silver, lead and zinc credits. |
|
|
(12) |
Gold cut-off grades utilized in 2020 reserves were as follows: oxide leach material not less than 0.13 gram per tonne; oxide mill material not less than 0.49 gram per tonne; and refractory mill material not less than 1.49 gram per tonne. |
|
|
(13) |
Gold cut-off grades utilized in 2020 reserves not less than 2.10 gram per tonne. |
|
|
(14) |
Cut-off grade utilized in 2020 reserves not less than 0.31 gram per tonne. |
|
|
(15) |
Cut-off grade utilized in 2020 reserves not less than 5.85 gram per tonne. |
|
|
(16) |
Stockpiles are comprised primarily of material that has been set aside to allow processing of higher grade material in the mills. Stockpiles increase or decrease depending on current mine plans. Stockpile reserves are reported separately where ounces exceed 100,000 and are greater than 5% of the total site-reported reserves. |
|
|
(17) |
Reserve estimates provided by Barrick, the operator of Pueblo Viejo. |
|
|
(18) |
Project is currently undeveloped. Reserve estimates provided by the NuevaUnión joint venture. |
|
|
(19) |
Project is currently undeveloped. Reserve estimates provided by the Norte Abierto joint venture |
|
|
(20) |
Gold cut-off grade varies with level of copper credits. |
|
|
(21) |
Cut-off grade utilized in 2020 reserves not less than 1.70 gram per tonne. |
|
|
(22) |
Kalgoorlie was sold during 2020 and classified as held for sale as of December 31, 2019. |
|
|
(23) |
Cut-off grade utilized in 2020 reserves not less than 0.67 gram per tonne. |
|
|
(24) |
Cut-off grade utilized in 2020 reserves not less than 3.10 gram per tonne. |
|
|
(25) |
Includes undeveloped reserves in the Ahafo trend totaling 3.4 million ounces. Cut-off grade utilized in 2020 reserves not less than 0.50 gram per tonne. |
|
|
(26) |
Cut-off grade utilized in 2020 reserves not less than 0.57 gram per tonne. |
|
|
(27) |
Reserve estimates provided by Barrick, the operator of the NGM joint venture. |
|
Contacts
Media Contact
Courtney Boone, 303.837.5159
[email protected]
Investor Contact
Eric Colby, 303.837.5724
[email protected]

