Stock Market Cycles Part II – Is Gold Setting Up For A Rally Above $2000 Again?
In Part I of this research article, I tried to highlight the major market cycle phases that often drive volatility, uncertainty, and bigger trends in the US/Global markets as well as Precious Metals. Additionally, my team and I highlighted the technical confluence pattern that has setup as Gold prices have rallied above downward sloping price channels (price Flags) recently. This confluence of technical patterns, while we are transitioning into a post-COVID-19 global economy, suggests that excess credit/debt issues throughout the global financial markets are seeking safety in preparation for some type of market reversion event.
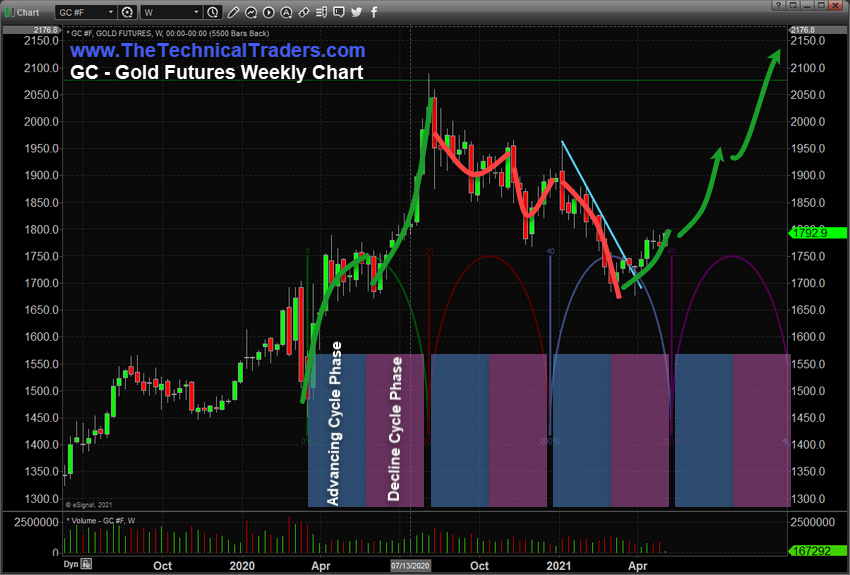
The recent move above $1900 in gold shows that precious metals are likely entering a new bullish price phase. We highlighted this in a May 3rd research article suggesting that a new advancing cycle phase may push Gold to levels above $2100. If our research is correct, Gold may continue to rally higher – reaching a peak sometime near mid-October 2021.
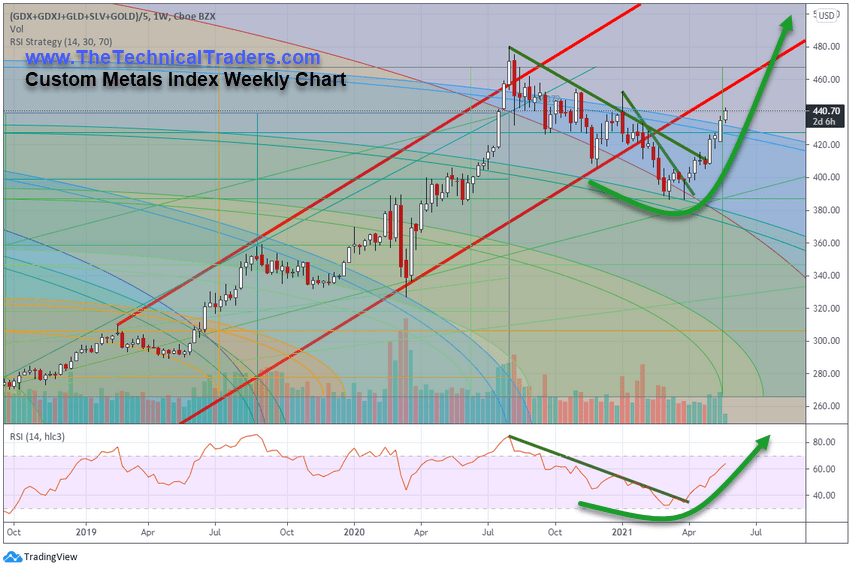
Our current Custom Metals Index chart shows the recent strength of the upside price trend in precious metals. Once Gold clears the $1960~$1965 level, prices should continue to advance to $2067, then $2305 moderately quickly. The $2067 level represents resistance just below the recent highs from August 2020 near $2087. It is important to understand how price moves in advancing/declining waves/phases over time. At this stage of the precious metals rally, which I believe is very similar to the 2003 to 2006 Gold rally, we may see Gold continue to rally higher while the US/Global markets continue to trend moderately higher. This is a shift in how capital is being deployed in anticipation of the US Fed and global central banks entering a tightening phase. This process also took place in 2005~2007 as the US Federal Reserve raised interest rates attempting to deleverage the markets in an orderly format. The major stock market indexes and precious metals continued to rally throughout this event because traders/investors had already started hedging risks of an unknown market event while the Fed continued to raise rates.
Sign up for my free trading newsletter so you don’t miss the next opportunity!
Currently, we know the US Federal reserve is planning on acting to potentially raise rates in 2022 or 2023 and there has been some discussion that the US Fed may need to take action earlier to avert inflation concerns. The similarities between the 2004~2007 gold rally to what we are seeing in Gold right now, are uncanny. We are seeing Gold rally to levels close to $2000 near an early stage of concern related to any potential deleveraging/reversion event. In 2004, Gold was trading near $350 and reached a high of $1923.70 in 2011 – a rally totaling over 450%. If something similar happens based on the recent price lows, Gold could rally to levels over $6500.
Our researchers are focused on a target level near $3750 right now. We believe the next advancing wave in Gold, over many months, will target $2300, then $3200, then $3750. See this research article from May 16th for more detailed price targets/setups.
As we move into the early Summer months, the one thing that everyone seems to be asking is “When will the markets start the next downside price correction or reversion event?”. A lot of the emails and questions we receive are related to our recent Gann research article as well as some of our other research articles related to the Excess Phase Peak patterns we’ve highlighted in Bitcoin, AAPL, TSLA, and others.
The answer to this question is as follows
- We don’t have any clear timing regarding if or when a reversion event will take place yet.
- We do have research, our Gann research article, that suggests this type of event would likely happen between April 2021 and August/September 2021.
- We also have some evidence that certain sectors have already started to execute the Excess Phase Peak pattern that we’ve highlighted in many interview and research articles recently.
- Currently, the markets have moved into a broad sideways Flagging pattern, which may be the start of the broader market peaking pattern. We don’t have any confirmation of this type of setup yet though.
- Our researchers are watching for a confluence of technical patterns across various sectors to help confirm our understanding of how and when any breakdown or reversion event may occur. We strongly advise technical traders watch the Transportation Index for signs of weakness ahead of any bigger reversion event.
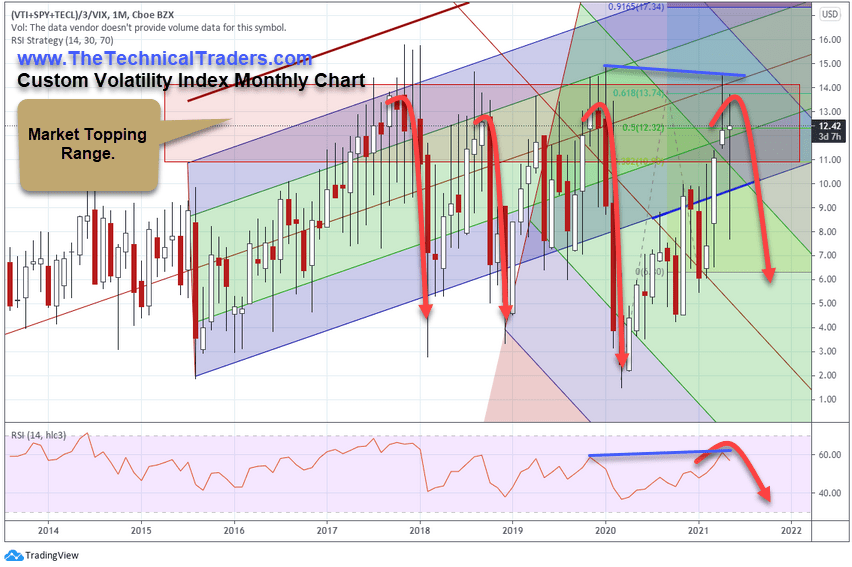
Our Custom Volatility Index Monthly chart highlights how fast and far the post-COVID recovery event has come. In prior years, 2017, 2018, and 2019, this index was able to reach levels above 12~13 fairly consistently (a topping/peak price range), which was often followed by a moderate reversion event (in most cases 8% to 26% pullbacks). Currently, this custom index has reached levels above 14 and has begun to stall near 12~13 – well within the topping range.
Any price weakness resulting after reaching these lofty levels is likely to prompt a fairly large 11~20% pullback in the markets. If the right conditions setup, after we’ve seen a big global market recovery rally, the reversion event may be even bigger than we expect.
When will it happen? We are not confident in trying to make any date/time predictions at this point. How will it happen? Our guess is that it will happen as traders rush to the sidelines as a result of perceived market extremes and perceived general weakness in trends. How deep could it pull back? Our estimate is a minimum of 11% to 20% right now – possibly targeting the 2018~2019 lows.
What we can tell you is that the upward move in precious metals appears to be a leading trend suggesting global traders are moving to hedge risks related to the global market reversion event (very similar to 2004~2007). In this early stage hedging event, traders move capital into precious metals as a hedge against broader market risks and declines.
Read our research articles in the Free Research section of our website to learn how you can prepare for these bigger price trends. 2021 and beyond are going to be incredible years for traders. Staying ahead of these sector trends is going to be key to developing continued success in these markets. As some sectors fail, others will begin to trend higher. Learn how BAN Trader Pro can help you spot the best trade setups.
Learn how our BAN Trader Pro Strategy can help you spot the best trade setups. We’ve built this strategy to help us identify the strongest and best trade setups in any market sector. Every day, we deliver these setups to our subscribers along with the BAN Trader Pro system trades. You owe it to yourself to see how simple it is to trade 30% to 40% of the time to generate incredible results.
Have a great day!!
Chris Vermeulen
Chief Market Strategist
www.TheTechnicalTraders.com

