US Stock Market Attempts To Break Support Channel – What’s Next?
The recent price volatility related to the surprise Jobs number, nearly ten days ago, and the potential for inflationary price trends extended beyond the Fed expectations has created a unique type of sideways price rotation on the INDU chart. This recent price volatility suggests the markets are struggling to identify future trend bias as well as attempting to shake out certain traders and investors (running stops).
Additionally, the downside price trend we’ve recently seen in Lumber, breaking away from the continued rally mode, and Bitcoin, breaking downward nearly -54% from recent highs, suggests a broad market “washout” is taking place. How far will this trend continue? Will the US stock market break downward like Bitcoin has recently done? Let’s take a look at the charts and try to answer some of these questions.
Before we continue exploring charts, I suggest readers review some of my recent research posts relating to this potential downward price trend in the US/Global markets, including: Are We Days Away From Potential Gann/Fibonacci Price Peak? (March 17, 2021); Market Leverage Reaches New All-Time Highs As The Excess Phase Rally Continues (April 25, 2021); and Are Apple, Tesla, and Bitcoin Entering a Technical ‘Excess Phase Top’? Should You Be In Cash Right Now? Part II (May 15, 2021).
Expect Continued Price Volatility As Markets Attempt To Establish New Trends
We’ll start by exploring the Dow Jones Industrial Average Daily chart, below, and the first thing we want to highlight is the extended upward (YELLOW) price trend channel. This upward sloping price channel has been in force since the March 2020 COVID-19 lows. It was confirmed by the November 2020 lows and retested in March 2021. Typically, when price channels this strongly over an extended period of time, the price channel becomes a psychological barrier/wall for price trending. When it is breached or broken, price trends often react moderately aggressively – with excessive volatility.
Over the past 10+ days, near the right edge of this chart, we can see that price has started to react with much higher volatility and broad sideways price trends. It appears the INDU chart has entered a new phase of market price activity – moving away from moderately low volatility bullish trending and into much higher volatility sideways rotation. We attribute this to a shift in how traders and investors perceive the future actions of the US Fed and how risks are suddenly much more prominent than they were 3+ weeks ago. It appears the “rally euphoria” has ended and traders are starting to adjust expectations related to a slower economic reflation of the global economy.
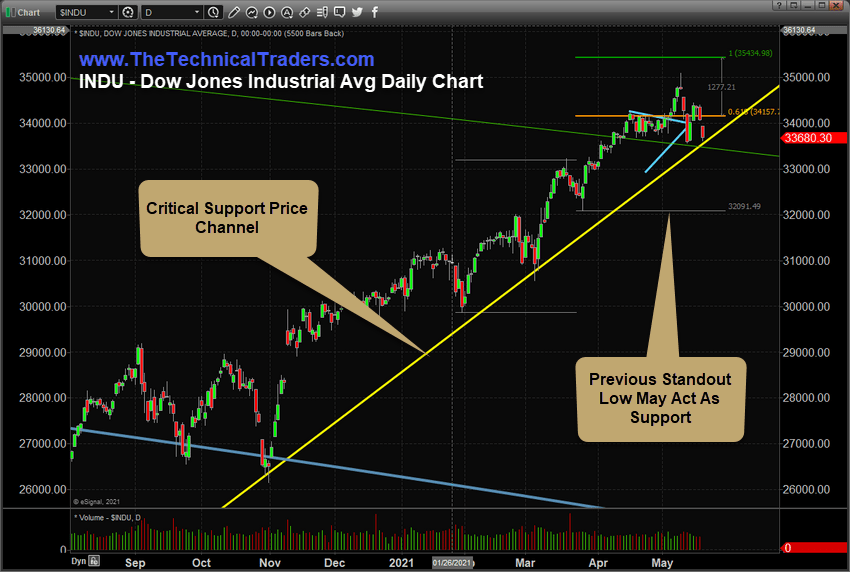
Depending on how traders and investors perceive the future growth opportunities in the US and global markets, as well as how new strains of the COVID-19 virus may continue to disrupt global economies, we may see a fairly big change in trend throughout the rest of 2021 and possibly into 2020. In our opinion, the tremendous rally phase that took place between October 2020 and now has been anchored on the perception that the COVID vaccines would allow for an almost immediate and nearly full economic recovery attempt. Now, after we are seeing various new strains of COVID ravage India, Europe, Africa and parts of South-East Asia, expectations may be changing quickly.
Everything Hinges On How Price Reacts Near The YELLOW Support Channel Line
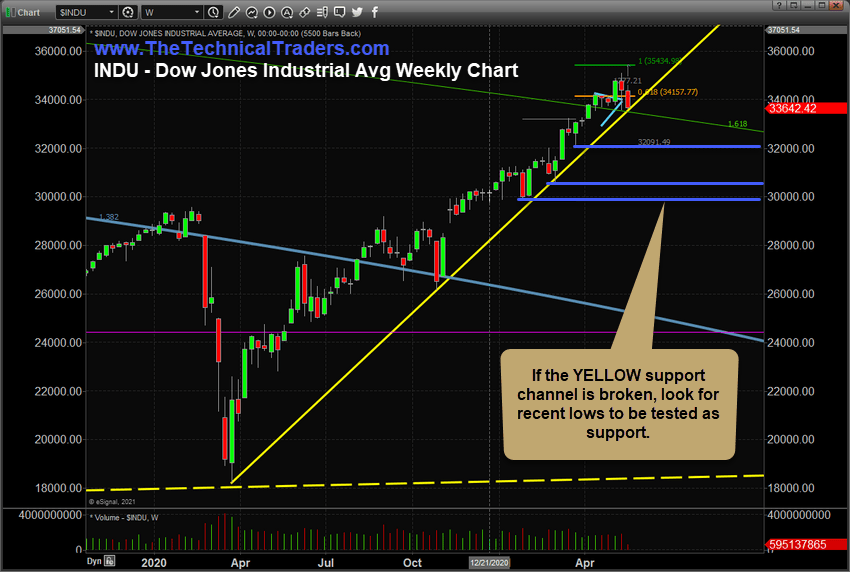
This Weekly Dow Jones Industrial Average chart highlights the same upward sloping price trend from the March 2020 COVID-19 lows. It also shows the start of the broad market rotation over the past three weeks and highlights three key “standout lows” that we interpret as critical support levels. These support levels are at $32,090, 30,575, and $29,875.
Sign up for my free trading newsletter so you don’t miss the next opportunity!
If we continue to see downward price trending which breaks through the YELLOW upward sloping price channel line, it is very likely that price will continue to move lower while attempting to find new support near these standout low price levels. This suggests any breakdown in the INDU may prompt a further -5% to -11% downside price move.
If the recent price rotation stalls and continues to find support above the YELLOW upward sloping price channel line, then we expect the US markets to transition into a sideways bottoming formation which will prompt another rally attempt in the near future.
Everything hinges on what happens over the next few weeks related to this key YELLOW upward sloping price channel.
What this means for traders and Investors is that certain market sectors are still posed for strength and growth over the next 6 to 12 months. The recent downside price volatility suggests broad market concerns related to a continued reflation trade are certainly evident in how the markets are trending. Yet, within this potential sideways rotation, there are sectors and trends that still present very real opportunities for profits. If the major US indexes find support above the YELLOW price channel line and attempt to mount another rally, traders need to be prepared for this potential opportunity in the markets – attempting to target the best and strongest market sectors.
As I just mentioned, everything hinges on what happens over the next few days and weeks related to the YELLOW price support channel. One way or another, the markets are either going to attempt to rally higher while this support channel holds or a bigger breakdown event may take place as price breaks below the support channel and attempts to find new, lower, support.
Learn why we moved our BAN clients into CASH over a week ago and learn how we use the BAN trading strategy to manage risks and take advantage of the strongest market sectors. Please take a minute to learn about our BAN Trader Pro strategy and how it can help you identify and trade better sector setups. Every day, we deliver these setups to our subscribers along with the BAN Trader Pro system trades. You owe it to yourself to see how simple it is to trade 30% to 40% of the time to generate incredible results.
Enjoy the rest of your day!!
Chris Vermeulen
Chief Market Strategist
www.TheTechnicalTraders.com

