Did The Global Markets Rollover In April/May 2021? What Next? Part I
This research article is designed to answer a few questions related to the current market contraction and the news related to the potential US Fed tightening of monetary policy while it appears China may be experiencing a credit/debt crisis in the early stages. Many traders/investors are contacting us asking our opinions of the current market situation and what we expect in the near future. This article should help answer a lot of your questions and help you to understand what may come next.
Broad Market Cycles Transitioned Near The End Of 2019 – Were You Paying Attention?
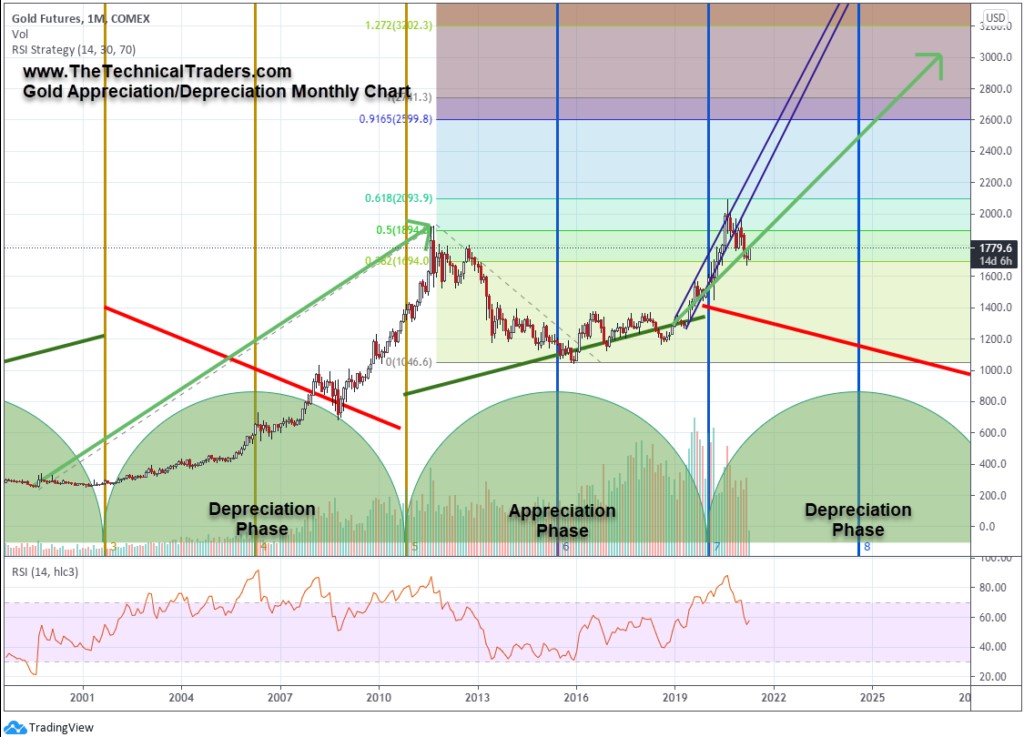
First, let’s discuss the broader market cycles that have changed over the past 24+ months. My research team published these articles suggesting the US and Global markets had recently transitioned away from an Appreciation price cycle and into a new Depreciation price cycle. This is very important to understand because the new Depreciation price cycle will likely change how investors perceive opportunities and how currencies fluctuate in an attempt to revalue after an extensive Appreciation price phase. The US Federal Reserve and global central banks have pushed the reflation trade (pre and post-COVID) well beyond a traditional Supply/Demand Equilibrium.
Most importantly, this research article highlights the transition into the new Depreciation Price Cycle and the fact that it should last until 2029 to 2031…
- November 27, 2020: HOW TO SPOT THE END OF AN EXCESS PHASE – PART II
- May 20, 2021: BITCOIN COMPLETES PHASE #3 OF EXCESS PHASE TOP PATTERN – WHAT NEXT?
- May 23, 2021: US DOLLAR BREAKS BELOW 90 – CONTINUE TO CONFIRM DEPRECIATION CYCLE PHASE
What is important to understand about this transition between cycle phases is that it is usually associated with an “Excess Phase Price Event”. This is most commonly seen as a euphoric price rally phase, or a bubble rally phase, that drives incredible price advances in various asset types. We’ve seen these excess phase rallies in Cryptos, various stock symbols, Lumber, Copper, and other commodity prices recently. Currently, Natural Gas, Uranium, and a host of others are experiencing these types of Excess Phase “Blow-Off” peaks.
Sign up for my free trading newsletter so you don’t miss the next opportunity to learn more!
The transition into a new Depreciation Price Cycle will likely prompt the US Dollar to weaken below $87~88 eventually, prompting a very strong rally in Precious Metals. But before that happens, the “Blow-Off” peaks must complete and burst. We need to see some type of anti-climax event that changes trader/investor sentiment and restores more normal price relationships to assets. We may be experiencing that right now – the end of the “Blow-Off” euphoric price cycle phase as the next few charts will attempt to illustrate.
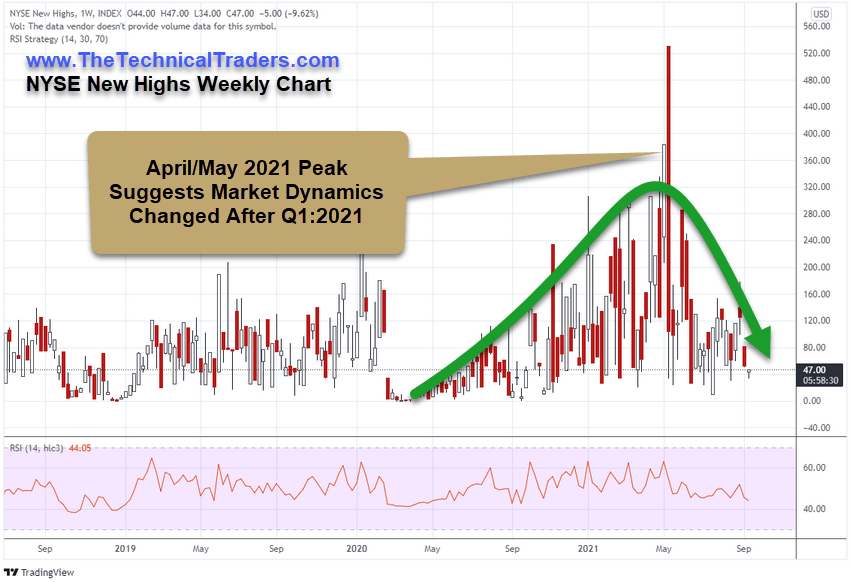
NYSE New Highs Collapse As US/Global Markets Rollover
This Weekly chart of the NYSE New Highs clearly illustrates the incredible rally after the March/April 2020 COVID collapse and the extreme new highs that were generated after the November 2020 US elections. In an incredible display of exuberance and euphoria, the NYSE New Highs level reached a massive 531 level on May 10, 2021. Since that time, the NYSE New Highs level has continued to consolidate below the 200 level and has recently moved below 100 as global equities continue to show weakness across the board.
I believe part of this cycle is related to the transition to the new Depreciation Price Cycle and another part of this is related to the Excess Phase “Blow-Off” peaking we’ve seen in price trends recently. Fundamentally, the markets must ramp up in activity and leverage for these excess phase processes to take place, and they must scale back and deleverage as these processes unwind. I still believe the US Federal Reserve will support the US markets and credit cycles throughout this transition, but as traders and investors move towards scaling back and unwinding leveraged trading positions near these peaks, we may see some aspects of overvalued market assets continue to contract over time.
S&P 500 Stocks Above 150 DMA Is About To Break Below 50 – Possibly Moving
Into Bearish Trending
This Weekly chart of the S&P 500 stocks above the 150 DMA shows quite a bit of history (originating near the start of 2018). Over this time frame, we can highlight two extended downtrends in price: the first happened in August/September 2018, and the second was the COVID-19 virus event. Every major downward price cycle over the past 3 to 4+ years has seen a decline below the 50 levels as the impulse downside price trend. Then, if the trends continue lower, we usually see a move below 20~30 and many weeks of extended downward trending before support is found by the markets.
Since COVID, the US Federal Reserve, and the US Government have enacted a number of support measures to take the pressures off consumers, banks, and many retailers and corporations. Now that these support systems are ending and the US/Global economy must transition back to more normal aspects of economic function, we may see a moderate sideways/downward price contraction in the US/Global markets if this level breaks below 40~50. Remember, we are not suggesting an all-out bearish market collapse at this phase of the market trend, but we are suggesting that traders/investors need to be aware that this current trend is not the “endless bull market trend” many are used to seeing since the COVID lows (March 2020). That trend ended in April/May 2021 and it looks like we may be in for a bit of a wild ride over the next 12+ months.
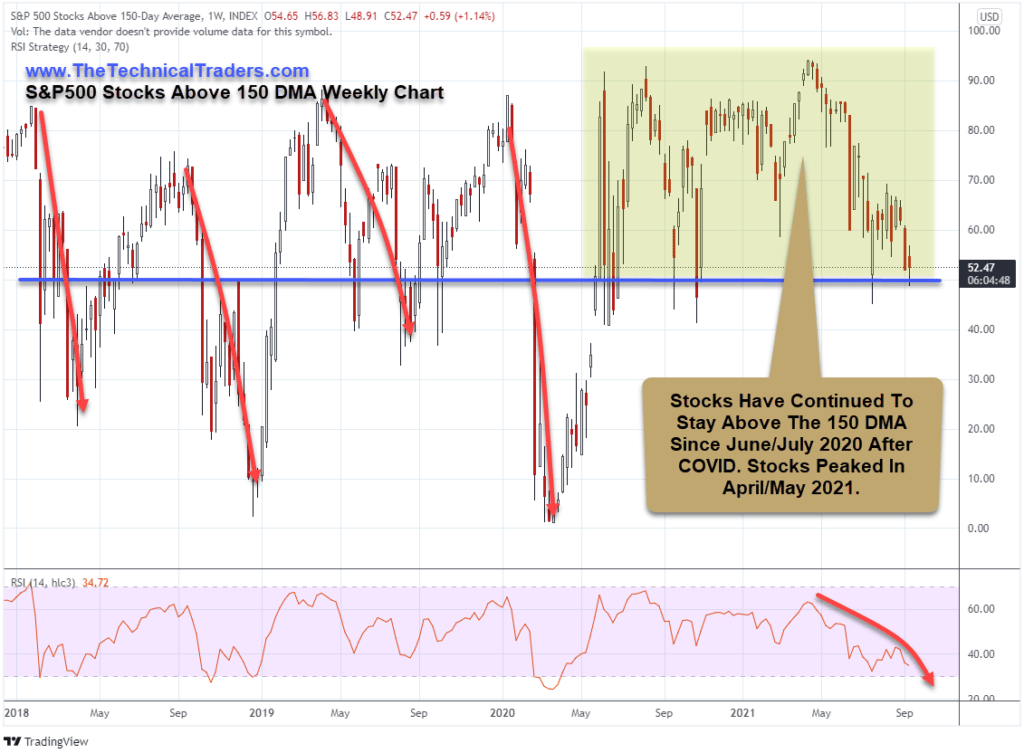
Still, at this point, we don’t have any real technical confirmation that the US market trends have broken into any new Bearish price trends. The transition from the Appreciation cycle to the new Depreciation cycle does not guarantee or suggest the US stock market will enter a big bearish price trend. What it does suggest is that volatility will increase while the US Dollar trends below $87 to $88 (eventually) and that Precious Metals will start to move dramatically higher. We are at the early stages of what appears to be the end of the “Blow-Off” rally phase that is complicated by the end of COVID policy, changes in US Fed plans, resumption of more normal economic functions, and an excessive credit/debt rally phase which is contracting.
All of this suggests the markets are about to become very volatile and big trends are going to roil through the global markets as a revaluation process takes place. This will present incredible opportunities for traders and investors who are capable of profiting from these huge trends and price rotations. It could also be very dangerous for those who continue to chase the rally trends with extended leverage.
In Part II of this research article, I’ll explore even more data and charts that support my conclusions and better illustrate what we should expect from the markets over the next 12 to 24+ months.
Please take a minute to learn about my BAN Trader Pro newsletter service and how it can help you identify and trade better sector setups. My team and I have built this strategy to help us identify the strongest and best trade setups in any market sector. Every day, we deliver these setups to our subscribers along with the BAN Trader Pro system trades. You owe it to yourself to see how simple it is to trade 30% to 40% of the time to generate incredible results.
As something entirely new, check out my initiative URLYstart to learn more about the youth entrepreneurship program I am developing. This is an online program of gamified entrepreneurship designed to introduce and inspire youth to start their own businesses. Click-by-click, each student will be guided from their initial idea, through the startup process all the way to their first sale and beyond. Along the way, our students will learn life lessons such as communication, perseverance, goal setting, teamwork, and more. My team and I are passionate about this project and want to reach as many people as possible!
Have a great day!
Chris Vermeulen
Chief Market Strategist

