S&P 500 At Tipping Point To Start A Bear Market And What You Need To See
Is a bear market on the way? My research suggests the downward sloping trend line (LIGHT ORANGE in the Daily/Weekly SPY chart below) may continue to act as solid resistance – possibly prompting a further breakdown in the markets for US major indexes.
As we’ve seen recently, news and other unexpected events prompt very large price volatility events in the US major indexes. For example, the VIX recently rose above 30 again, which shows volatility levels are currently 3x higher than normal levels.
Increased Volatility & The Start Of An Excess Phase Peak Should Be A Clear Warning
This increased volatility in the markets, coupled with the increased fear of the US Fed and the global unknowns (Ukraine, China, Debt Levels, and others), may be just enough pressure to crush any upside price trends over the next few months. Technically, my research suggests the 5 to 0 level is critical resistance. The SPY must climb above these levels to have any chance of moving higher.
Sign up for my free trading newsletter so you don’t miss the next opportunity!
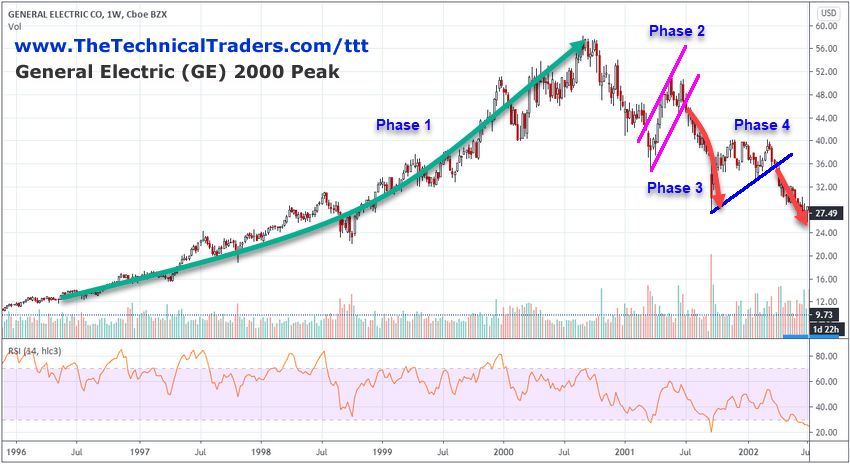
Unless the US markets find some new support and attempt to rally back towards recent highs, an “Excess Phase Peak” pattern will likely continue to unfold throughout 2022. This unique price pattern appears to have already reached a Phase 2 or Phase 3 setup. Please take a look at this Weekly GE example of an Excess Phase Peak pattern and how it transitions through Phase 1 through Phase 4 before entering an extended Bearish price trend.
Read this research article about Excess Phase Peaks: HOW TO SPOT THEN END OF AN EXCESS PHASE – PART 2
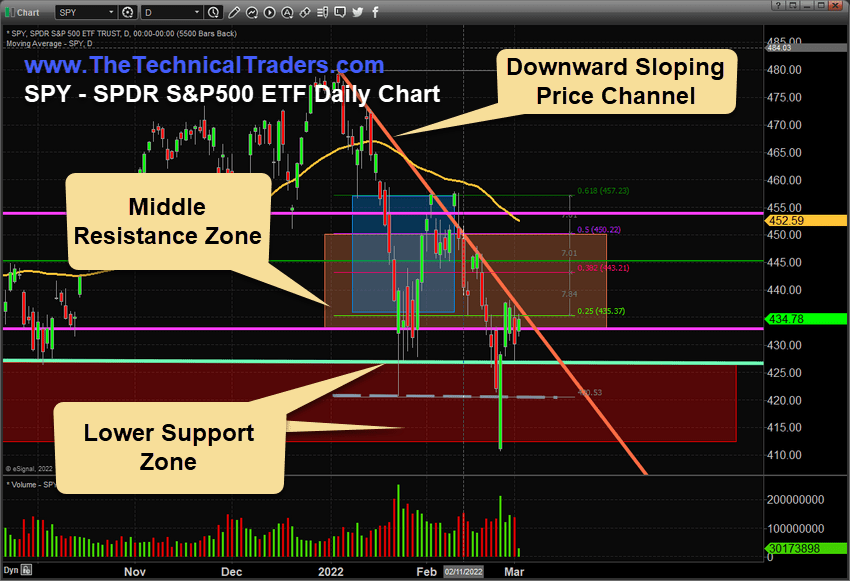
SPY May Already Be In A Phase 4 Excess Peak Phase
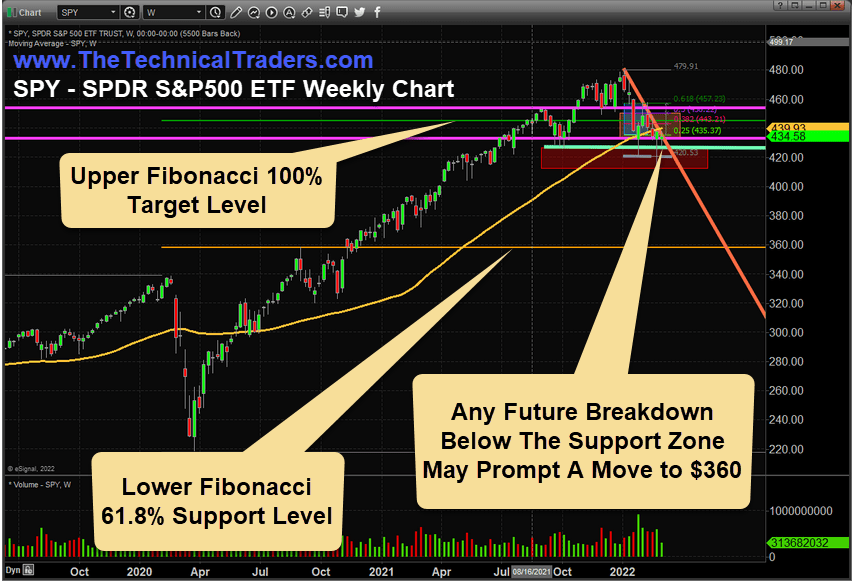
This Daily SPY chart highlights my analysis, showing the major downward sloping trend line, the Middle Resistance Zone, and the lower Support Zone. Combined, these are acting as a “Wedge” for price over the past few weeks – tightening into an Apex near 5~440.
If the US major indexes attempt to break this downward price trend, then the price must attempt to move solidly above this downward sloping price channel and try to rally back into the Resistance Zone (near 5~0). Unless that happens, the price will likely transition into a deeper downward price move, attempting to break below recent lows, near 0, and possibly quickly moving down to the 0 level.
SPY Weekly Chart Shows Consolidation Near 5 – Possibly Starting A Phase 4 Excess Peak
Traders should stay keenly aware of the risks associated with the broad US and global market decline as the Ukraine war, and other unknowns continue to elevate fear and concerns related to the global economy. In my opinion, with the current excess global debt levels, extended speculative market bubbles, and the continued commodity price rally, we may be starting to transition away from an extended growth phase and into a deeper depreciation cycle phase.
My research suggests we entered a new Depreciation cycle phase in late 2019 and are already more than 25 months into a potential 9.5-year global Depreciation cycle. What comes next should not surprise anyone.
Read this article about Depreciation Cycle Phases: HOW TO INTERPRET & PROFIT FROM THE RISKS OF A DEPRECIATION CYCLE
Traders should stay keenly focused on market risks and weaknesses. I expected the conflict in Ukraine to have been priced into the US markets over the past 7+ days. However, I believe the markets were unprepared for this scale or invasion and will attempt to settle fair stock price valuation levels as the conflict continues. This is not the same US/Global market Bullish trend we’ve become used to trading over the past 5+ years.
Looking Forward – preparing for a possible Bear market
Market dynamics and trends are changing from what we have experienced over the past 40 years for stocks and bonds. The 60/40 portfolio is costing you money now. Traders need an edge to stay ahead of these markets trends and to protect and profit from big trends.
The only way to navigate the financial markets safely, no matter the direction, is through technical analysis. By following assets and money flows, we identify trend changes and move our capital into whatever index, sector, industry, bond, commodity, country, and even currency ETF. By following the money, you become part of new emerging trends and can profit during weak stock or bond conditions.
Want Trading Strategies that Will Help You To Navigate Current Market Trends?
Learn how I use specific tools to help me understand price cycles, set-ups, and price target levels in various sectors to identify strategic entry and exit points for trades. Over the next 12 to 24+ months, I expect very large price swings in the US stock market and other asset classes across the globe. I believe the markets are starting to transition away from the continued central bank support rally phase and may start a revaluation phase as global traders attempt to identify the next big trends. Precious Metals will likely start to act as a proper hedge as caution and concern start to drive traders/investors into Metals.
I invite you to learn more about how my three Technical Trading Strategies can help you protect and grow your wealth in any type of market condition by clicking the following link: www.TheTechnicalTraders.com
Chris Vermeulen
Chief Market Strategist
Founder of TheTechnicalTraders.com
The post S&P 500 At Tipping Point To Start A Bear Market And What You Need To See appeared first on Technical Traders Ltd..

