Waiting For GLD To Make New Highs – Gold Rally Is Still Intact
The calm of the last 3-weeks has resulted in a risk-on environment. This, in turn, has led to a nice recovery rally in stocks. For the time being, volatility has subsided. However, we believe there are many underlying market risks that can still resurface without any warning.
From late 2015 to August 2020, the price of gold doubled, going from approximately 40 to 80. Gold then experienced a profit-taking 0 pullback. Gold’s rally over the past 12-months failed to break through its 80 price level. After retreating back to 0, gold seems to have found support at the 00 level.
In reviewing the following spot gold chart, it appears we have broken out of an accumulation phase and seem to be preparing to move above the 80 high.
XAUUSD – GOLD SPOT / U.S. DOLLAR – WEEKLY CHART
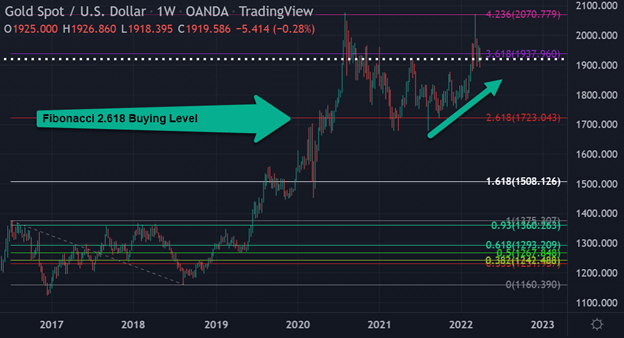
www.TheTechnicalTraders.com – TradingView
GLD-ETF RALLIED +22% OVER THE LAST 12-MONTHS
GLD – SPDR Gold Shares is the largest physically-backed gold exchange-traded fund (ETF) in the world. According to its founder, State Street Global Advisor’s website www.spdrgoldshares.com “the economic forces that determine the price of gold are different from the economic forces that determine the price of many other asset classes such as equities, bonds or real estate.”
Utilizing the (www.tradingview.com) Fibonacci projection tool, we see that the GLD price accumulation from July 2016 through August 2018 resulted in a 2-year rally and a profit of or an approximate gain of +73%.
Additionally, we see that the GLD top made in August 2020 was at the Fibonacci 4.618 level of 3.44. The 7-month correction in GLD found support at the Fibonacci 2.618 level of 7.98. The rally in GLD during the last 12-months also failed a second time at the Fibonacci 4.618 level.
GLD now appears to have broken out of its accumulation phase and seems to be preparing to trade above the 4 high.
GLD – SPDR GOLD SHARES – NYSE – WEEKLY CHART
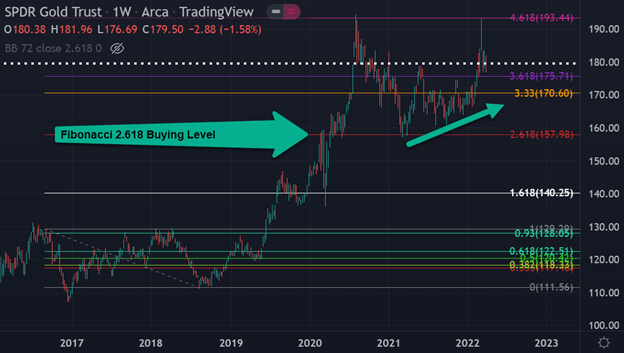
www.TheTechnicalTraders.com – TradingView
NEWMONT MINING RISES ABOVE
Newmont – Gold Mining Company (NEM) is up +33.46% year to date compared to the S&P 500 -4.62%. According to www.newmont.com, “Newmont is the world’s leading gold company and a producer of copper, silver, zinc, and lead.
Newmont’s bull market started back in September 2015. During the past 6-years, Newmont’s stock price has experienced several strong rallies that ranged from + to + each. Newmont’s recent price level is now four times greater than the low it made in 2016.
Utilizing the same Fibonacci tool, but this time measuring from the lows to the lows, we learn that Newmont had a strong reaction down after reaching the key level. However, this reaction found buying support at the Fibonacci 2.618 level of .67. Newmont has since rallied by , which has allowed its price to blow through its previous top resistance level.
Newmont may be showing us that the gold spot and the GLD-ETF will both make new highs.
NEM – NEWMONT ‘GOLD MINING’ – NYSE – DAILY CHART
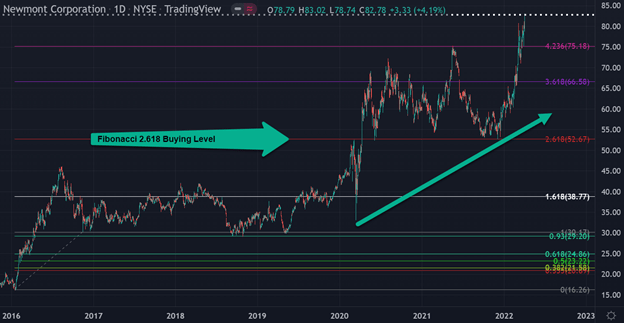
www.TheTechnicalTraders.com – TradingView
KNOWLEDGE, WISDOM, AND APPLICATION ARE NEEDED
It is important to understand that we are not saying the market has topped and is headed lower. This article is to shed light on some interesting analyses of which you should be aware. As technical traders, we follow price only, and when a new trend has been confirmed, we will change our positions accordingly. We provide our ETF trades to our subscribers, and somewhat surprisingly, we entered five new trades last week, four of which have now hit their first profit target levels and two of which have now been closed at a profit. Our models continually track price action in a multitude of markets, asset classes, and global money flow. As our models generate new information about trends or a change in trends, we will communicate these signals expeditiously to our subscribers and to those on our trading newsletter email list.
Sign up for my free trading newsletter so you don’t miss the next opportunity!
Successfully trading is not limited to when to buy or sell stocks or commodities. Money and risk management play a critical role in becoming a consistently profitable trader. Correct position sizing utilizing stop-loss orders helps preserve your investment capital and allows traders to manage their portfolios according to their desired risk parameters. Additionally, scaling out of positions by taking profits and moving stop-loss orders to breakeven can complement ones’ success.
WHAT STRATEGIES CAN HELP YOU NAVIGATE The CURRENT MARKET TRENDS?
Learn how we use specific tools to help us understand price cycles, set-ups, and price target levels in various sectors to identify strategic entry and exit points for trades. Over the next 12 to 24+ months, we expect very large price swings in the US stock market and other asset classes across the globe. We believe the markets have begun to transition away from the continued central bank support rally phase and have started a revaluation phase as global traders attempt to identify the next big trends. Precious Metals will likely start to act as a proper hedge as caution and concern begin to drive traders/investors into Metals and other safe-havens.
We invite you to join our group of active traders and investors to learn and profit from our three ETF Technical Trading Strategies. We can help you protect and grow your wealth in any type of market condition by clicking on the following link: www.TheTechnicalTraders.com
Chris Vermeulen
Chief Market Strategist
Founder of TheTechnicalTraders.com
The post Waiting For GLD To Make New Highs – Gold Rally Is Still Intact appeared first on Technical Traders Ltd..

