Where Are Investors Putting Their Money – Now Vs. Then?
Investors have been processing high inflation reports, rising interest rates, surging energy, commodity, and real estate prices. So, what is the market saying about which markets investors have favored the last couple of years vs where are they putting their money right now?
A way to determine this is to simply plot the indices and then see how they stack up against each other. Price data should also be viewed and analyzed in a multi-timeframe environment: short-term, medium-term, and long-term.
As a trader or investor, we know it’s important to determine if a market is in a bull, bear, accumulation, or distribution phase. Additionally, we want to know how the market we’re trading is performing compared to its peers.
The following charts provide snapshots of how the SPY ETF (US S&P 500) is doing compared to the other US and global stock indices.
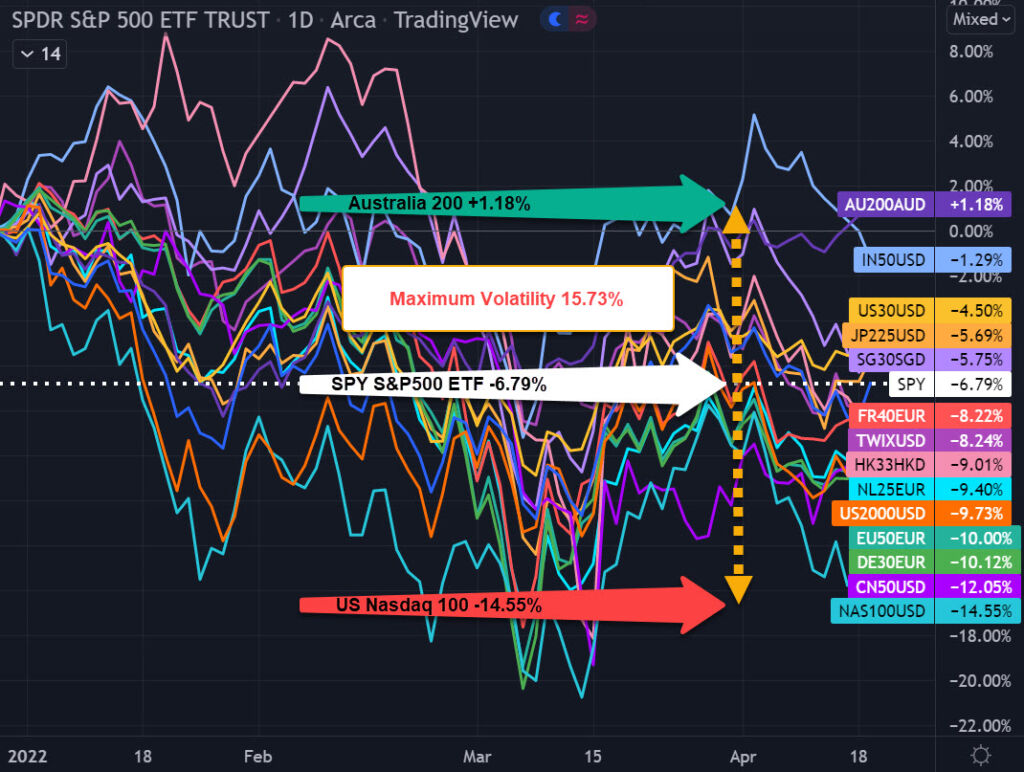
The year-to-date chart is showing us a maximum volatility spread of 15.73%. This is simply the difference between the highest stock index, Australia 200 +1.18% vs the lowest stock index US Nasdaq 100 -14.55%. Australia’s market has recently done well due to its strong energy and commodity interests which in turn has contributed to the strengthening Australian dollar.
SPY YEAR-TO-DATE DAILY: MAX VOLATILITY 15.73%
www.TheTechnicalTraders.com – TradingView
The volatility spread at first doesn’t seem that significant but over time it can be substantial. This is one of the reasons why our team continually tracks global money flow according to each country’s stock index but additionally other types of markets and asset classes. Our quantitative trading research is crucial in determining which markets to trade and how to efficiently employ trading capital.
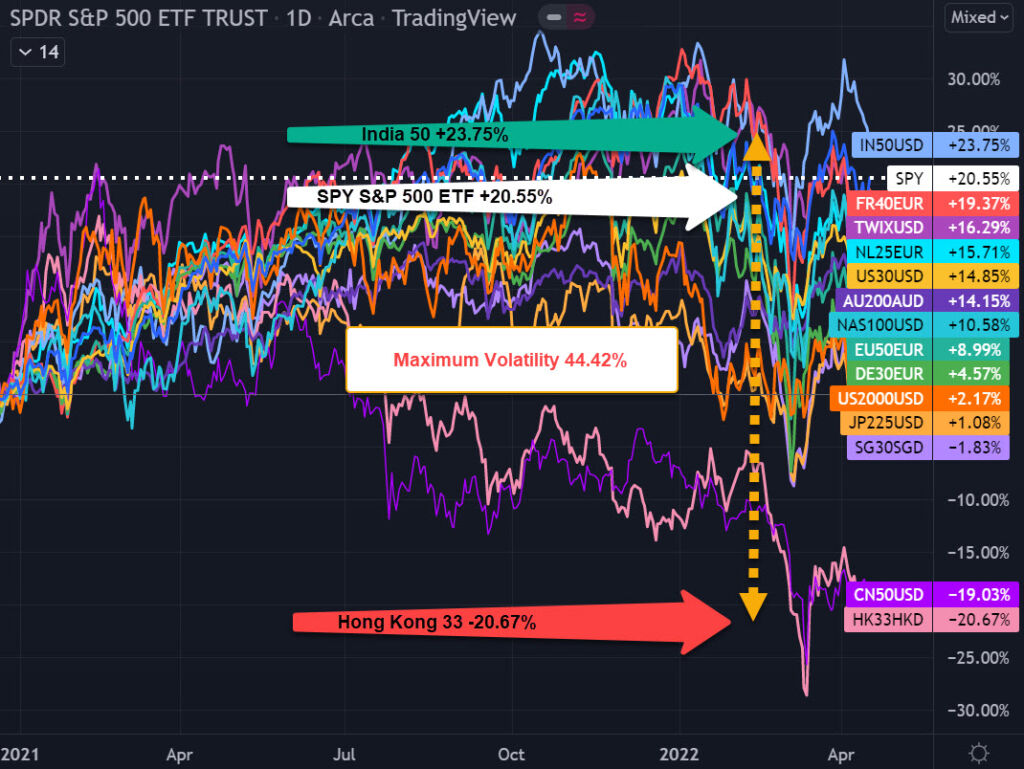
This maximum volatility spread during 2021-2022 is 44.42%. The highest stock index, India 50 +23.75% vs the lowest stock index Hong Kong 33 -20.67%. The Hong Kong and China stock markets have been plagued with numerous Covid issues in 2020, 2021, and now recently again in 2022.
SPY 2021-2022 DAILY: MAX VOLATILITY 44.42%
www.TheTechnicalTraders.com – TradingView
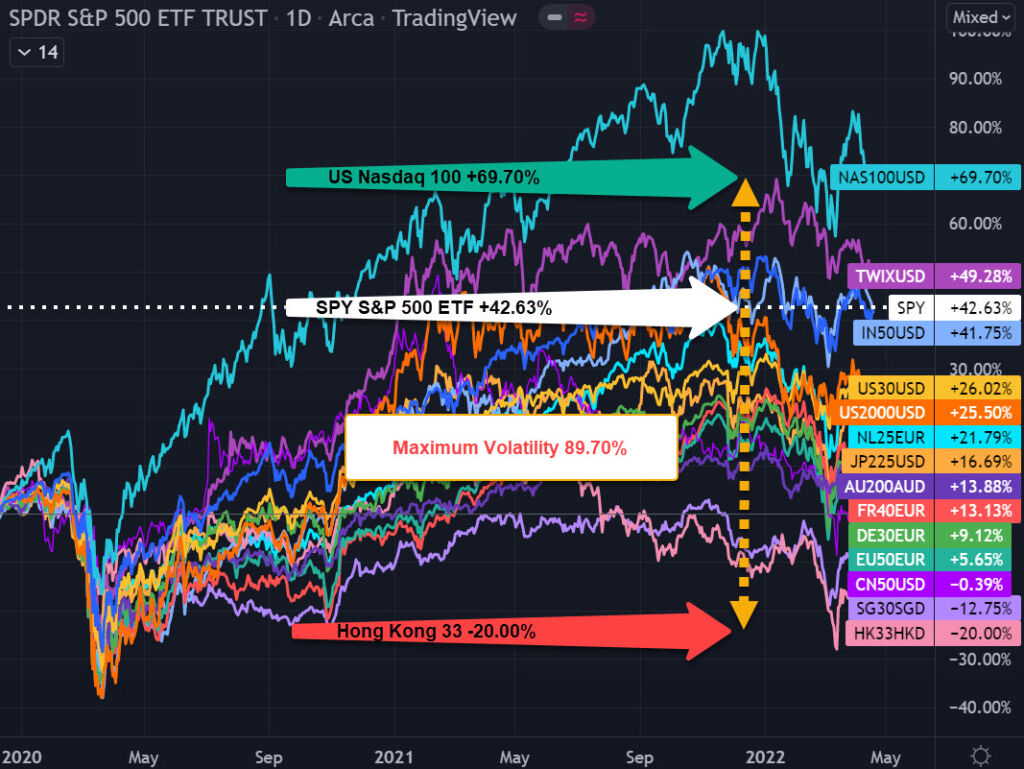
Now we can take a longer-term view of the past 2+ years covering Covid before and after. We notice that the Nasdaq 100 is the overall leader despite its recent negative performance in 2022.
This maximum volatility for 2020-2022 is 89.70%. The highest stock index, US Nasdaq 100 +69.70% vs the lowest stock index Hong Kong 33 -20.00%.
SPY 2020-2022 DAILY: MAX VOLATILITY 89.70%
www.TheTechnicalTraders.com – TradingView
KNOWLEDGE, WISDOM, AND APPLICATION ARE NEEDED
It is important to understand that we are not saying the market has topped and is headed lower. This article is to shed light on some interesting analyses of which you should be aware. As technical traders, we follow price only, and when a new trend has been confirmed, we will change our positions accordingly. We provide our ETF trades to our subscribers, and in the last six trades we entered in March, all have now been closed at a profit! Our models continually track price action in a multitude of markets, asset classes, and global money flow. As our models generate new information about trends or a change in trends, we will communicate these signals expeditiously to our subscribers and to those on our trading newsletter email list.
Sign up for my free trading newsletter so you don’t miss the next opportunity!
Successful trading is not limited to when to buy or sell stocks or commodities. Money and risk management play a critical role in becoming a consistently profitable trader. Correct position sizing utilizing stop-loss orders helps preserve your investment capital and allows traders to manage their portfolios according to their desired risk parameters. Additionally, scaling out of positions by taking profits and moving stop-loss orders to breakeven can complement ones’ success.
WHAT STRATEGIES CAN HELP YOU NAVIGATE The CURRENT MARKET TRENDS?
Learn how we use specific tools to help us understand price cycles, set-ups, and price target levels in various sectors to identify strategic entry and exit points for trades. Over the next 12 to 24+ months, we expect very large price swings in the US stock market and other asset classes across the globe. We believe the markets have begun to transition away from the continued central bank support rally phase and have started a revaluation phase as global traders attempt to identify the next big trends. Precious Metals will likely start to act as a proper hedge as caution and concern begin to drive traders/investors into Metals and other safe-havens.
Historically, bonds have served as one of these safe-havens, but that is not proving to be the case this time around. So if bonds are off the table, what bond alternatives are there and how can they be deployed in a bond replacement strategy?
We invite you to join our group of active traders and investors to learn and profit from our three ETF Technical Trading Strategies. We can help you protect and grow your wealth in any type of market condition by clicking on the following link: www.TheTechnicalTraders.com
Chris Vermeulen
Chief Market Strategist
Founder of TheTechnicalTraders.com
The post Where Are Investors Putting Their Money – Now Vs. Then? appeared first on Technical Traders Ltd..

