Do Fed Rate Decisions Affect The Price Patterns For Gold?
Many traders are focused on Gold as price has contracted over the past 5+ weeks, and the $1700 level is being retested. This prompted my team and I to do some research related to the US Federal Reserve’s recent rate increases and how Gold has previously reacted to rising and falling interest rates.
Exploring Price Patterns Between Gold and Fed Rate Decisions
I knew from the 2008-09 Global Financial Crisis and the 2020 COVID-19 event that Gold initially moves downward as extreme selling pressures drive almost all assets lower. Yet, in both cases, Gold quickly rebounded and began to move higher within 5+ weeks after setting up a bottom.
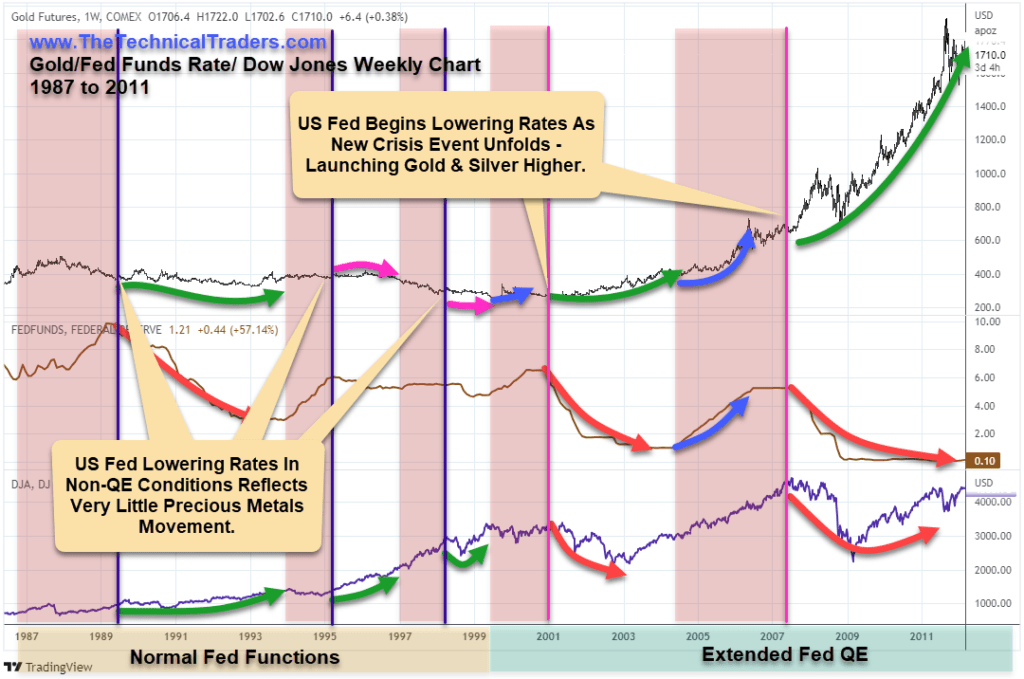
I started my research by outlining “Normal Fed Activity” and “Extended QE Fed Activity” to see if I could identify any difference in how Gold reacted to fear and uncertainty in these phases. My thinking was that Gold would react more muted in a price range in Normal Fed Activity phases because crisis events and economic uncertainty are more muted overall. When the Fed enters an expansive QE phase, this activity is associated with a US/Global economy that requires extraordinary measures to prompt expected normal capital functions.
I quickly learned that Gold tends to stay fairly muted through Fed rate increases and decreases in the absence of Fed QE functions. Yet, I learned something even more extraordinary about how Gold trends within extended Fed QE Functions: The Two-Stage Capitulation Bottom.
The Two-Stage Gold Setup In QE Fed Activities
This unique pattern seems to be associated with extended fear related to the US Fed (and global central banks) decisions to print extended capital and provide extraordinary capital support for global equity markets and the economy. It does not appear to happen in credit contraction phases. So keep this in mind as we continue to watch global central banks navigate future economic concerns.
My belief is that extended central bank QE functions are already baked into the current Gold price pattern and will continue to drive the two-stage pattern over the next 24+ months.
Defining The Two-Stage Gold Pattern
This pattern is relatively simple to understand when one considered the psychology behind the price moves. It starts with a Fed Funds Rate Increase after an extended period of lower Fed Funds Rate levels. When the Fed starts to raise rates, Gold tends to experience an almost immediate rally. Here are some recent examples:
| Dates | FFR Rate Increase | Gold Increase |
| Oct-93 ~ Feb-96 | 3% ~ 6% | +22% |
| Apr-99 ~ Jul-99 | 4.75% ~ 6.5% | +33% |
| Apr-04 ~ Jul-06 | 1.0% ~ 5.25% | +95% |
| Oct-15 ~ Aug-19 | 0.13% ~ 2.42% | +46% |
| Mar-21 ~ Now | 0.07% ~ 1.21% | +24% |
Each of these Gold rally phases was accompanied by a second-stage Gold rally when the US Fed suddenly reversed direction and started lowering Fed Funds Rates. It appears this panic by the Fed sends a jolt of fear into the markets – driving Gold & Silver into a potential parabolic price trend if the conditions are right. Here are some examples.
| Dates | FFR Rate Increase | Gold Increase |
| Oct-93 ~ Feb-96 ~ Dec-98 | 3% ~ 6% ~ 4.63% | +22% ~ -28% |
| Apr-99 ~ Jul-99 ~ Dec-03 | 4.75% ~ 6.5% ~ 1.0% | +33% ~ +67% |
| Apr-04 ~ Jul-06 ~ Sept-11 | 1.0% ~ 5.25% ~ 0.08% | +95% ~ +245% |
| Oct-15 ~ Aug-19 ~ Apr-20 | 0.13% ~ 2.42% ~ 0.10% | +46% ~ +49% |
| Mar-21 ~ Now | 0.07% ~ 1.21% ~ Unknown | +24% ~ Unknown |
Examples Of This Two-Stage Precious Metals Rally Pattern
The most recent examples of this two-stage precious metals rally pattern happened in 2008-09 and 1999-2001. The COVID-19 example is still a valid example, yet that setup/cycle concluded very quickly as an anomaly event.
Global Financial Crisis
In 2008-09, after the initial rally phase prompted by raising rates from Apr-04 to July-06, Gold collapsed as the 2008-09 GFC crisis unfolded. Gold quickly recovered back to near previous highs over an 18-week span after establishing a bottom. Then, Gold consolidated for 33 weeks before launching into an incredible parabolic rally phase – close to 10 months after Gold bottomed in October 2008 (see the Green Arrow Rally on the Gold Chart Below).
Recession
From 1999-2001, a similar price pattern unfolded in Gold. This time, the bottom in Gold setup in February 2001, and it took an additional 67 weeks for Gold to rally back to near recent highs before stalling and rallying further upward as the US Fed reacted to the 9/11 attacks.
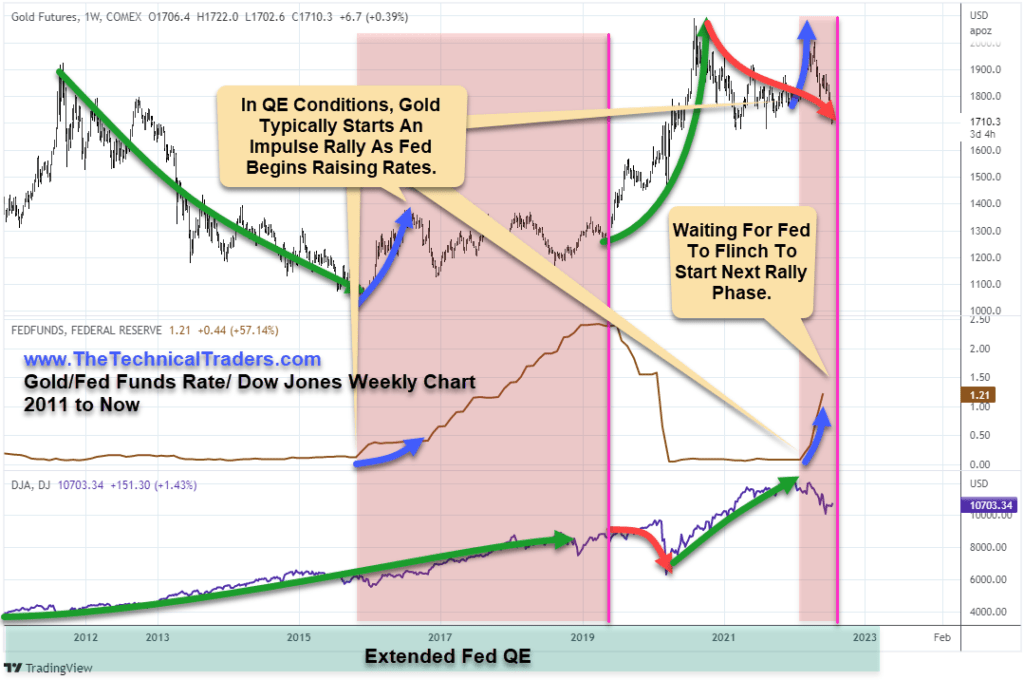
Current Gold Price Action
Currently, Gold has collapsed to price levels near $1700 after trading above $2000 just a few months ago as the US Fed aggressively raised interest rates attempting to combat inflation. I’m not trying to guess if/when the Fed will change course, but I do believe Gold is poised for a very significant rally from any bottom set up by the current two-phase price pattern.
If history is any example, this current contraction in Gold and Silver is very likely a reaction to the sudden inflation crisis event and may prompt future price rally anyone’s imagination. Global central banks around the world are continuing to push QE in some form while the US Fed is attempting to raise rates. If the US Fed suddenly shifts towards more Dovish policies, I believe a new wave of fear will drive Gold higher – starting the second phase of the rally.
If the Fed raises rates one or two more times before changing policy, that would simply build more momentum for any future breakout in precious metals.
Concluding Thoughts
As long as some quantifiable measure of stimulus or QE exists throughout the US/EU/Chinese economies, I believe this expansionary two-stage cycle in Gold & Silver will continue to play out.
We have already experienced the early rally phase associated with the initial Fed rate increase. Now, we are in the contraction price phase where a bottom will set up – which may take many weeks or months still. We are waiting for the Fed to “flinch” and begin to decrease rates. That will start the new bullish price phase for Gold and Silver – and possibly send us into another parabolic price phase.
HOW WE CAN HELP YOU LEARN TO INVEST CONSERVATIVELY
At TheTechnicalTraders.com, my team and I can do these things:
- Safely navigate the commodity and crude oil trend.
- Reduce your FOMO and manage your emotions.
- Have proven trading strategies for bull and bear markets.
- Provide quality trades for investing conservatively.
- Tell you when to take profits and exit trades.
- Save you time with our research.
- Proved above-average returns/growth over the long run.
- Have consistent growth with low volatility/risks.
- Make trading and investing safer, more profitable, and educational.
Sign up for my free trading newsletter so you don’t miss the next opportunity!
We invite you to join our group of active traders who invest conservatively together. They learn and profit from our three ETF Technical Trading Strategies. We can help you protect and grow your wealth in any type of market condition. Click on the following link to learn how: www.TheTechnicalTraders.com.
Chris Vermeulen
Founder & Chief Market Strategist
TheTechnicalTraders.com
The post Do Fed Rate Decisions Affect The Price Patterns For Gold? appeared first on Technical Traders Ltd..

