Crude Oil Prices – Will They Hold Above Key Support Level Or Begin To Unwind?
Talk of a Global Recession may prompt a broad decline in Crude Oil prices as the excesses of the past 10+ years unwind. This unwinding process pushed to the forefront for traders and investors has been prompted by a massive inflationary expansion after the COVID-19 lockdowns. How will it play out in the short-term and long-term?
Unwinding Excess Price Cycle Phase May Push Crude Oil Below $60 ppb
I believe Crude Oil will contract as the initial reduction in demand associated with high-priced gasoline and oil products and the threat of a Global Recession recede. This decline in Crude Oil prices is complicated as China/Asia economic and COVID crisis events continue to disrupt consumer discretionary income and asset valuation levels.
Crude Oil prices are an excellent measure of consumer engagement and activity worldwide. As an economy grows, demand for Crude Oil increases as manufacturers, suppliers, service & support companies, and shipping companies must keep up. When an economy slows, or consumers decrease spending habits, Crude Oil starts declining as overall demand decreases.
The best way to interpret this is that consumers spend willingly when stocks and home prices skyrocket. Yet, they turn away from spending when stocks and home prices turn downward. It is a natural, psychological reaction to unknowns and stress.
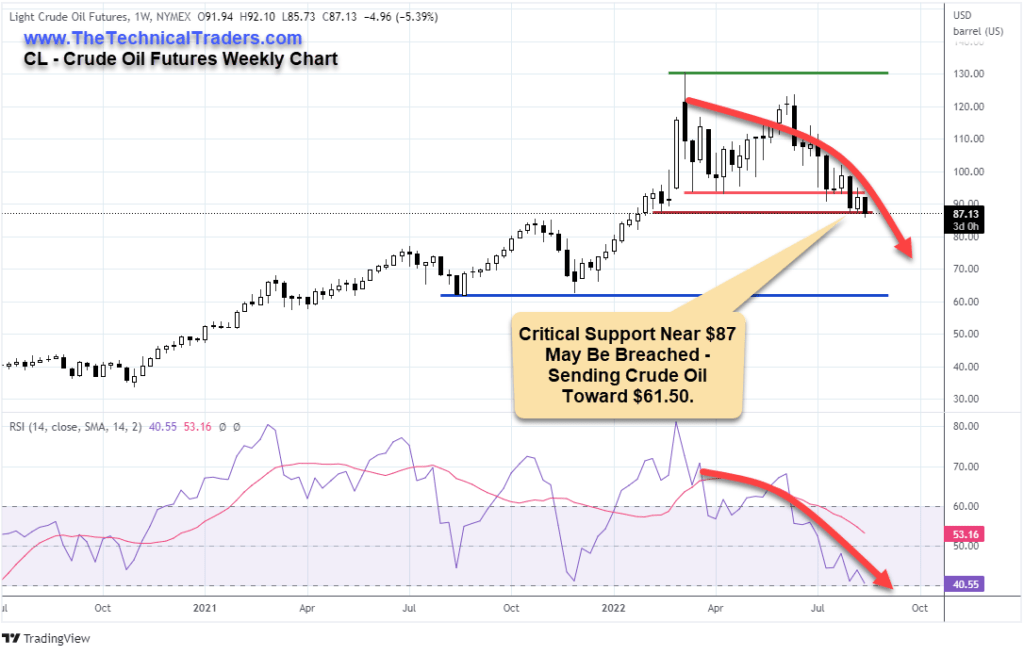
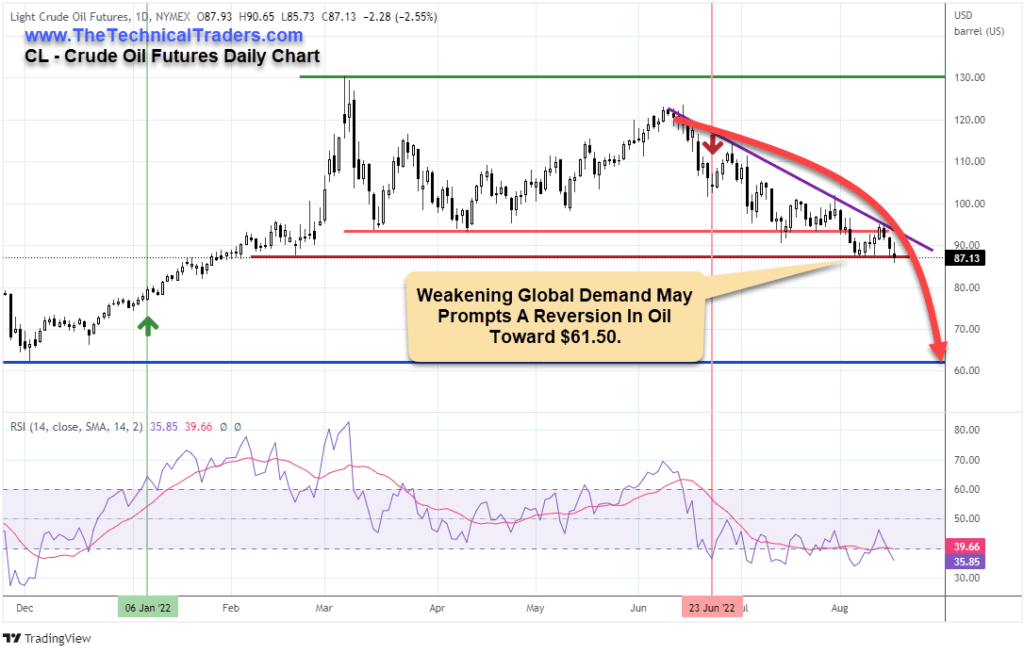
Critical Support Near $87 May soon Be Breached
This Daily Crude Oil Chart highlights the key price highs and lows as Fractal levels. It is essential to understand that the nearest real support level below $87 is just above $61 for Crude Oil. If Crude Oil continues to slide downward, I believe a strong downward price trend may occur if the $87 support level is breached.
This would also suggest that a broad energy sector decline could take place over a 30~60-day period as Crude Oil attempts to identify new support. Yet, I believe this downward trend will be temporary in the longer-term scope of Crude Oil trends.
After the 2007-08 Global Financial Crisis, Crude Oil collapsed by -77%, from $145 to $34, then rallied +232% to over $113 by 2011. If a Global Recession phase continues through the end of 2022 or into 2023, I suggest the recovery phase will prompt a solid recovery in Crude Oil prices over the next 3+ years.
Post-COVID Excesses Seem Similar To The 2007-08 Market Peak
The initial contraction in the US markets throughout the start of the 2007-08 Global Financial Crisis occurred during an extended peaking pattern in the US stock market. It began to gain downward momentum as the US financial system started breaking down (Lehman, Bear Sterns, & Others). The collapse in the financial markets broke consumer expectations and spending habits as demand for commodities collapsed.
This same type of market malaise seems to be currently taking place as the post-COVID rally phase has run its course and the global markets slide into a sideways price malaise – waiting for the “Lehman Moment.”
I suspect the current demand destruction related to inflationary trends, high gasoline prices, and the threat of another global house price peak may be sending consumers into a similar contraction cycle. This is why I believe Crude Oil will slide below the $87 price level and attempt to find new support near $61 before we see any real upward price trends in the energy sector.
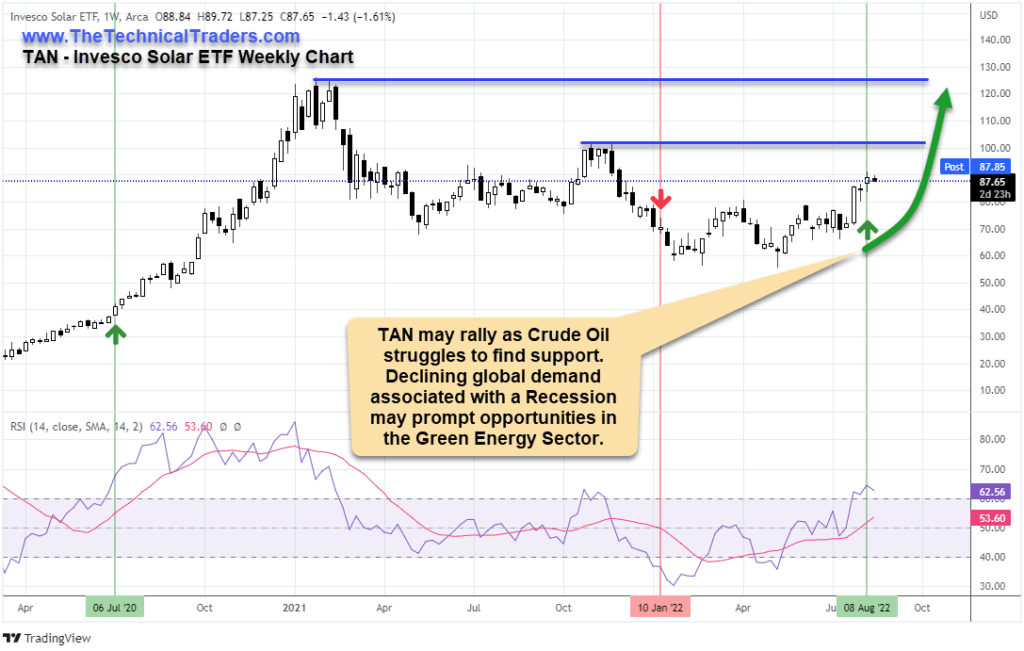
Alternate Energy May Surprise While Oil Moves Downward
Providing an opportunity for traders, Solar, Battery, and other new forms of energy may experience a boom cycle while Crude Oil contracts. Crude Oil is used in all forms of manufacturing, transportation, and other aspects of the global economy. Yet, while Crude Oil contracts, alternative energy sources may experience a rising price cycle.
President Joe Biden just signed the Inflation Reduction Act into law, pushing a massive $369 billion into new energy security and climate change (Source: Smartasset.com). This new investment in alternative energy sources, green energy, and increased Crude Oil supply will dramatically shift opportunities within the Energy Sector.
TAN, the Invesco Solar Energy ETF, may rally more than 15% to levels above $101 before possibly continuing higher to retest the $120 to $125 2021 highs.
Learn how our Total ETF Portfolio strategies can help you more efficiently protect and trade these big sector trends while keeping you away from high-risk setups.
LEARN FROM OUR TEAM OF SEASONED TRADERS
In today’s market environment, it’s imperative to assess our trading plans, portfolio holdings, and cash reserves. As professional technical traders, we always follow the price. At first glance, this seems very straightforward and simple. But emotions can interfere with a trader’s success when they buck the trend (price). Remember, our ego aside, protecting our hard-earned capital is essential to our survival and success.
Successfully managing our drawdowns ensures our trading success. The larger the loss, the more difficult it will be to make up. Consider the following:
- A loss of 10% requires an 11% gain to recover.
- A 50% loss requires a 100% gain to recover.
- A 60% loss requires an even more daunting 150% gain to simply break even.
Recovery time also varies significantly depending upon the magnitude of the drawdown:
- A 10% drawdown can typically be recovered in weeks to a few months.
- A 50% drawdown may take many years to recover.
Depending on a trader’s age, they may not have the time to wait nor the patience for a market recovery. Successful traders know it’s critical to keep drawdowns with reason, as most have learned this principle the hard way.
Sign up for my free trading newsletter, so you don’t miss the next opportunity!
We invite you to join our group of active traders who invest conservatively together. They learn and profit from our three ETF Technical Trading Strategies. We can help you protect and grow your wealth in any type of market condition. Click on the following link to learn how: www.TheTechnicalTraders.com.
Chris Vermeulen
Founder & Chief Market Strategist
The post Crude Oil Prices – Will They Hold Above Key Support Level Or Begin To Unwind? appeared first on Technical Traders Ltd..

