Will Inflation Data Result In More Aggressive Action By The FED?
Recent CPI/Inflation data suggests the current wave of global inflation is far from “transitory” and may persist for many months – possibly years. Some believe it is primarily a supply-side issue related to the COVID shutdowns. I think it is a combination of factors driving higher inflation right now (capital creation, stimulus, a broad speculative phase that existed after COVID, and supply side issues).
The result is the US Fed may now find itself pushed even further to raise rates aggressively to combat inflation trends. This may push the US/Global markets into a new downward price phase as we near a broad Pennant/Flag formation that apexes near December 15, 2022.
Fed Decision Could Push Global Economies In Dangerous Downward Price Phase
The CPI/PPI numbers inherently lag economic trends by 4 to 6+ months. I’m sure the US Fed is aware of the risks related to any further aggressive rate hikes. Yet, I’m also sure the Fed will do whatever is necessary to move ahead of perceived inflation trends.
The two charts below, the CPI & PPI Year-over-Year data, clearly show the increasing cost factors for producers and consumers, which started nearly 9+ months after the COVID lockdowns in March 2020. The reality of the world at that time was that supplies were diminishing because almost everything throughout the world was shut down or operating at significantly reduced capacity.
Now, as we move back into a mode where capacity and supply are rebuilding, we’ll see how quickly these inflationary trends weaken – if at all. The world is still dealing with supply-side issues, and the US economy continues to run stronger than many other foreign economies. Thus, the demand side may stay elevated for a while – unless the Fed turns aggressive with rate hikes and destroys consumer demand to some degree.
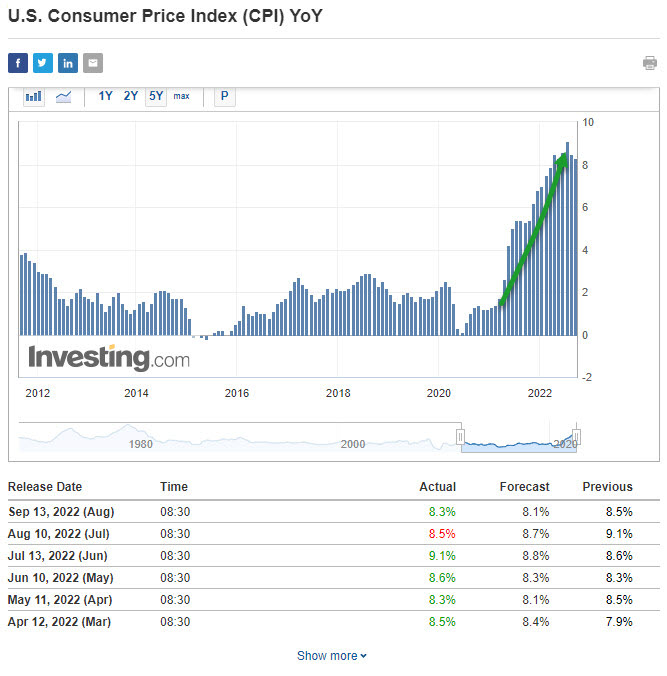
(Source: https://www.investing.com/economic-calendar/cpi-733)
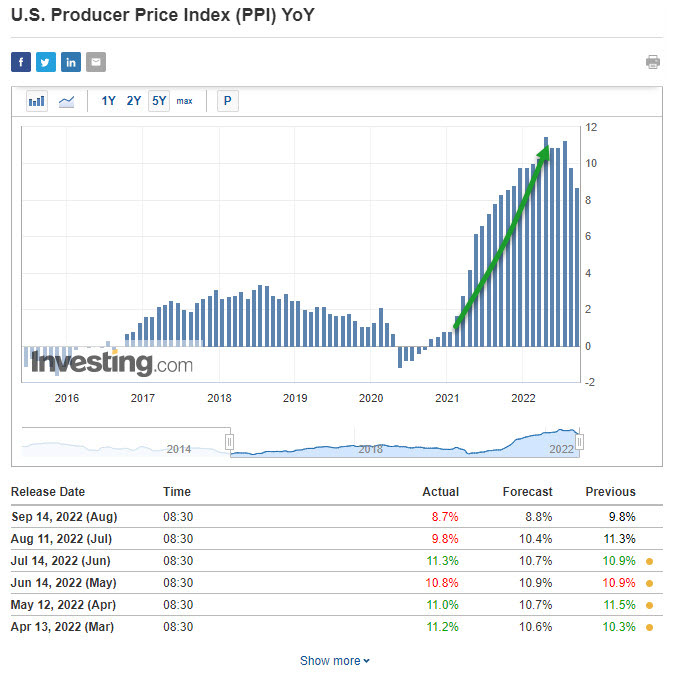
(Source: https://www.investing.com/economic-calendar/ppi-734)
SPY Moving Towards Apex Breakout/Breakdown Before December 15, 2022
All eyes will be on the US Fed next week as traders/investors prepare for what may become a very big price cycle/phase. I believe traders/investors have continued to anticipate a different Fed with Powell at the helm. The strength of the markets over the past 30+ days suggests traders believe the Fed will be more cautious of bursting economic prosperity than it may have been in the past.
After living through the DOT COM bubble, the 2008-09 Financial Crisis, and COVID, any new broad destructive economic phase brought about by the US Fed pushing rates too high could have catastrophic results.
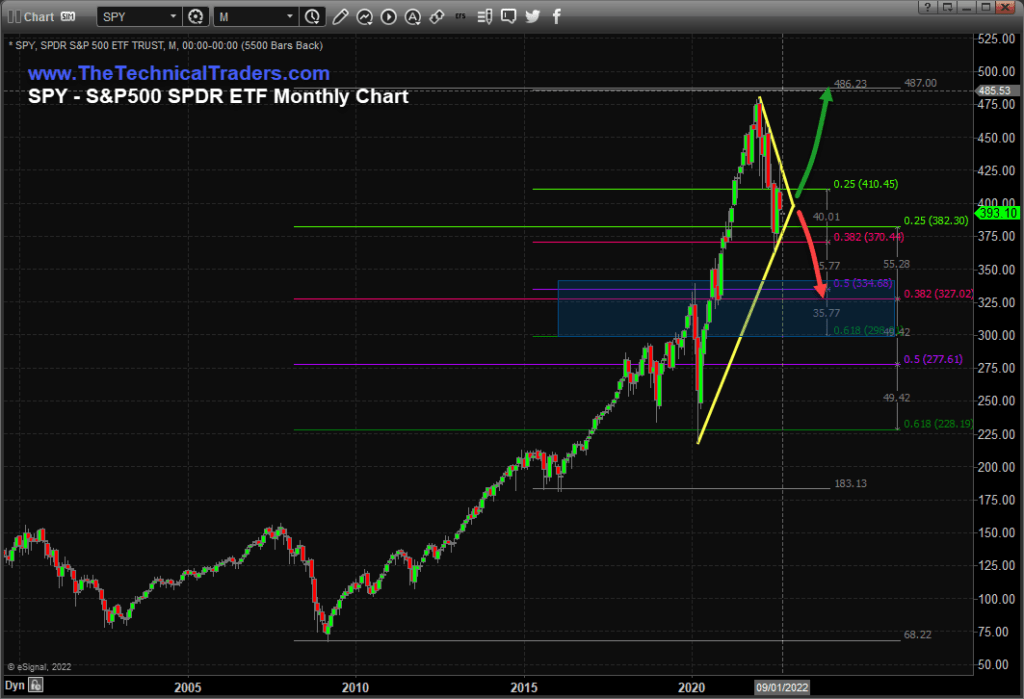
SPY Flag/Pennant Apexing Near December 15, 2022
This Monthly SPY chart highlights the current strength of the US S&P 500 SPDR ETF – still +82.5% above the COVID lows and +16.70% above the pre-COVID highs.
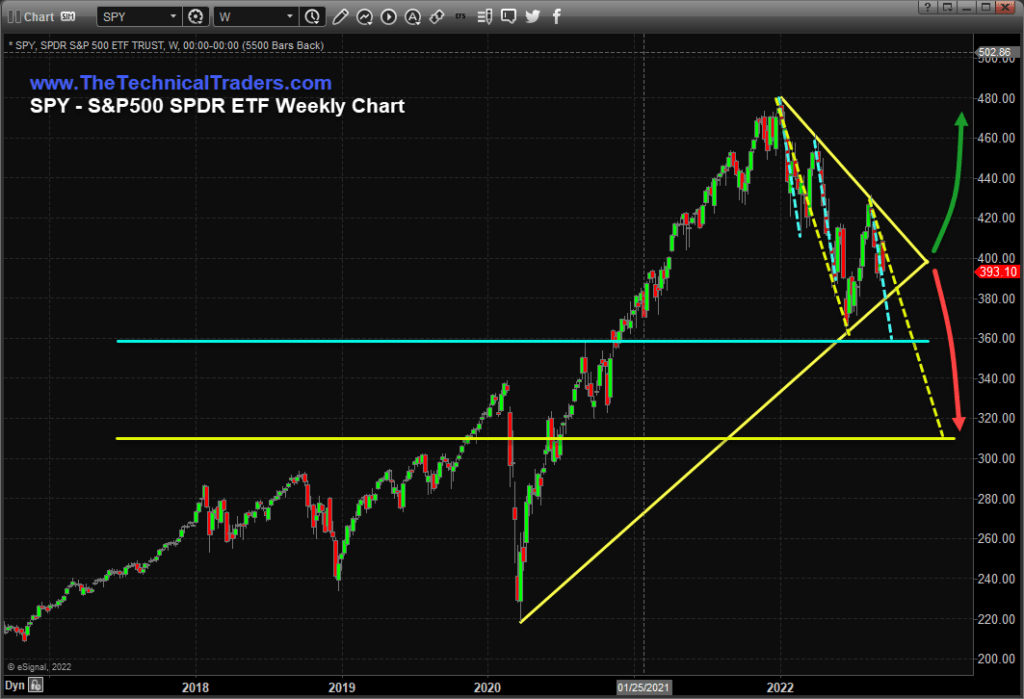
This Weekly SPY chart shows the same Flag/Pennant formation, yet I want to highlight the potential for a breakdown price trend targeting $359~361 (near the pre-COVID highs) and a deeper level near $312~318 (YELLOW LINE). Both levels represent 100% Measured Price Moves correlating to existing price trends from the peak near the start of 2022.
If we do see a breakdown in price trend because of an aggressive Fed rate decision, traders and investors need to understand where the next support levels may be found. It is doubtful that inflation will persist past Q1 or Q2 2023 as supply capacity is restored and the post-COVID constraints return to normal. Yet, we still have many months of unknowns related to how the US Fed will act and if any new event will disrupt global supply channels (think energy, credit markets, debt).
Right now, traders and investors need to stick with the first rule of trading: Protect Capital from excessive risks and only trade when the strongest opportunities exist.
LEARN FROM OUR TEAM OF SEASONED TRADERS
In today’s market environment, it’s imperative to assess our trading plans, portfolio holdings, and cash reserves. As professional technical traders, we always follow the price. At first glance, this seems very straightforward and simple. But emotions can interfere with a trader’s success when they buck the trend (price). Remember, our ego aside, protecting our hard-earned capital is essential to our survival and success.
Successfully managing our drawdowns ensures our trading success. The larger the loss, the more difficult it will be to make up. Consider the following:
- A loss of 10% requires an 11% gain to recover.
- A 50% loss requires a 100% gain to recover.
- A 60% loss requires an even more daunting 150% gain to simply break even.
Recovery time also varies significantly depending upon the magnitude of the drawdown:
- A 10% drawdown can typically be recovered in weeks to a few months.
- A 50% drawdown may take many years to recover.
Depending on a trader’s age, they may not have the time to wait nor the patience for a market recovery. Successful traders know it’s critical to keep drawdowns with reason, as most have learned this principle the hard way.
Sign up for my free trading newsletter so you don’t miss the next opportunity!
We invite you to join our group of active traders who invest conservatively together. They learn and profit from our three ETF Technical Trading Strategies. We can help you protect and grow your wealth in any type of market condition. Click on the following link to learn how: www.TheTechnicalTraders.com.
Chris Vermeulen
Founder & Chief Market Strategist
The post Will Inflation Data Result In More Aggressive Action By The FED? appeared first on Technical Traders Ltd..

