SSR Mining Reports Third Quarter 2023 Results
THIRD QUARTER 2023 HIGHLIGHTS (1)
- ATTRIBUTABLE AND ADJUSTED ATTRIBUTABLE DILUTED EARNINGS PER SHARE OF $0.07 AND $0.26, RESPECTIVELY
- QUARTERLY PRODUCTION OF 192,195 GOLD EQUIVALENT OUNCES AT COST OF SALES OF $1,095 AND AISC OF $1,289 PER OUNCE
- YEAR-TO-DATE PRODUCTION OF 495,668 GOLD EQUIVALENT OUNCES AT COST OF SALES OF $1,173 AND AISC OF $1,516 PER OUNCE
- REMAIN ON TRACK FOR THE LOW-END OF CONSOLIDATED PRODUCTION GUIDANCE OF 700,000 GOLD EQUIVALENT OUNCES
- QUARTERLY OPERATING CASH FLOW AND FREE CASH FLOW OF $135.3 MILLION AND $87.8 MILLION, RESPECTIVELY
- QUARTERLY OPERATING CASH FLOW AND FREE CASH FLOW BEFORE WORKING CAPITAL ADJUSTMENTS OF $142.4 MILLION AND $94.9 MILLION, RESPECTIVELY
- YEAR-TO-DATE 2023 CAPITAL RETURNS NOW TOTAL APPROXIMATELY $88.5 MILLION; ON TRACK FOR A MINIMUM FULL-YEAR CAPITAL RETURNS YIELD OF 3.6%
- ACCESSED FIRST ORE FROM THE ÇAKMAKTEPE EXTENSION PROJECT DURING THE THIRD QUARTER, FIRST PRODUCTION DELIVERED IN LATE SEPTEMBER IN LINE WITH GUIDANCE; EXPLORATION CONTINUES WITH AIM TO EXPAND MINERAL RESERVES AND RESOURCES
- PRODUCTION GUIDANCE TO BE RELEASED IN Q1/24 OUTLINING INITIATIVES TO DRIVE PRODUCTION GROWTH FROM EXPANSION PROJECTS
- INITIAL HOD MADEN INFILL DRILLING COMMENCES WITH AIM TO DE-RISK PRODUCTION RAMP-UP; POSITIVE RESULTS INCLUDE 90 METERS AT 16.5 G/T GOLD AND 1.56% COPPER
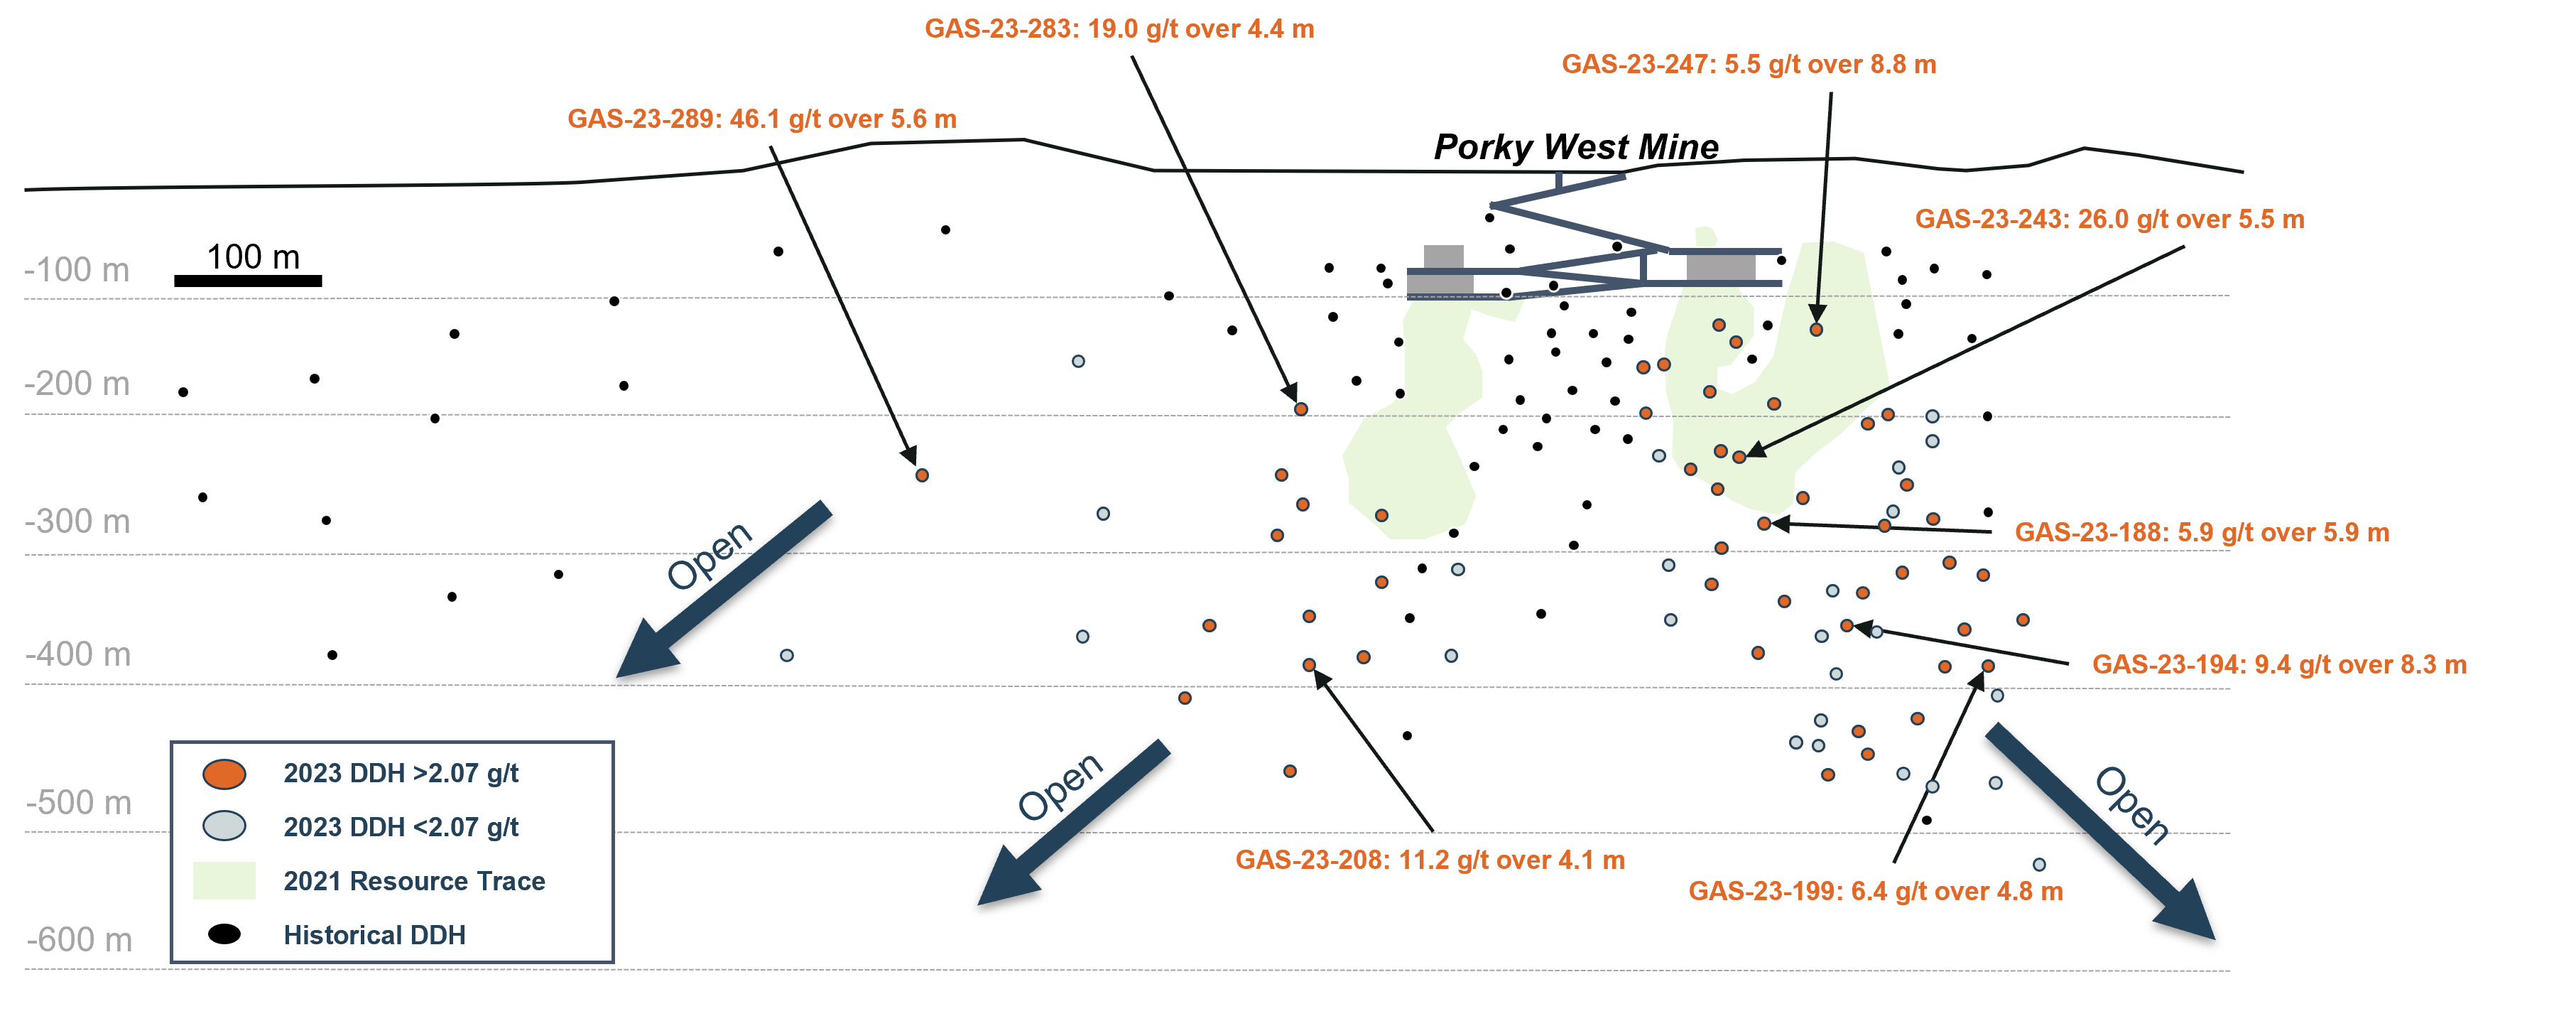
- SEABEE EXPLORATION CONTINUES TO ILLUSTRATE MINE LIFE EXTENSION POTENTIAL AT THE PORKY TARGETS, INCLUDING 5.6 METERS AT 46.1 G/T GOLD
- CONTINUED EXPLORATION AT THE CORTADERAS TARGET AT PUNA RETURNS 190 METERS AT 155 G/T SILVER AND 10.6% ZINC
- MARIGOLD EXPLORATION RESULTS EXPECTED TO OFFSET DEPLETION; ANALYSIS OF FUTURE GROWTH PATHWAYS AT NEW MILLENNIUM AND INITIAL MINERAL RESOURCES AT BUFFALO VALLEY ADVANCING
- CONTINUED NON-CORE ASSET RATIONALIZATION PROGRAM WITH THE DIVESTITURE OF THE SUNRISE LAKE EXPLORATION PROPERTY
DENVER–(BUSINESS WIRE)–SSR Mining Inc. (NASDAQ/TSX: SSRM, ASX: SSR) (“SSR Mining” or the “Company”) reports consolidated financial results for the third quarter ended September 30, 2023. In addition, the Board of Directors declared a quarterly cash dividend of $0.07 per common share payable on December 11, 2023 to holders of record at the close of business on November 13, 2023. This dividend qualifies as an ‘eligible dividend’ for Canadian tax purposes.
Rod Antal, Executive Chairman of SSR Mining, said, “The third quarter of 2023 featured strong operating and financial results that were well aligned to our forecasts, including record production from Marigold and record throughput at Puna. In addition, first ore from Çakmaktepe Extension was accessed late in the quarter, and the project is on track to deliver initial production of 10,000 to 15,000 ounces in the fourth quarter of 2023 as planned. The results to date continue to put us on track for the lower-end of our production guidance in 2023.
![]()
![]()
As we work towards a strong finish to the year, we have also committed a substantive effort towards the advancement of refreshed technical reports for both Marigold and Çöpler. To ensure we best align the reoptimized production profiles at each asset with the growth trajectory of the overall portfolio, we now expect to release the results of this ongoing technical work alongside our guidance forecasts and updated Mineral Reserves and Resources in February 2024. The interim analysis of the work completed to-date is revealing initial positives with respect to replacing and expanding our Mineral Reserve and Mineral Resource base through recent exploration success.
At Çakmaktepe Extension in particular, continued exploration success has pointed to potential growth beyond the current Mineral Reserves at the mine. This increased scale has led to the re-evaluation of prior plans to heap leach the project’s oxide ore at recovery rates averaging approximately 60%. We are currently conducting trade-off studies evaluating the benefit of installing additional grinding and leaching capacity in the Çöpler processing facility to meaningfully improve gold recoveries. This value accretive pathway has the potential to increase the profitability of Çakmaktepe Extension, but will result in a delayed ramp up to full production levels from the mine until late 2026 given the potential addition of this incremental processing equipment.
As a result of the ongoing efforts to optimize our portfolio, the business is entering a three-year growth capital investment period, particularly at Hod Maden and Çöpler, and we expect adjustments to the production and cost profile over the upcoming three- to five-year period as compared to prior life of mine plans. While initial work to-date indicates that mine resequencing and optimization activities across the portfolio will drive 2024 production that is lower than 2023 levels at higher costs, annual gold production will grow as development projects at Hod Maden, Marigold and Çöpler are completed. We are excited by the high-return growth opportunities on the horizon as we continue to expand both the production levels and net asset value of our portfolio.”
(1) The Company reports non-GAAP financial measures including adjusted attributable net income, adjusted attributable net income per share, cash generated by operating activities before working capital adjustments, free cash flow, free cash flow before changes in working capital, total cash, net cash (debt), cash costs and all-in sustaining costs (“AISC”) per ounce sold (a common measure in the mining industry), to manage and evaluate its operating performance at its mines. See “Cautionary Note Regarding Non-GAAP Financial Measures” for an explanation of these financial measures and a reconciliation of these financial measures to the most comparable GAAP financial measures.
Third Quarter 2023 Highlights: (1)
(All figures are in US dollars unless otherwise noted)
- Strong quarterly operating performance: The Company delivered third quarter 2023 production of 192,195 gold equivalent ounces at Cost of sales of $1,095 per gold equivalent ounce and AISC of $1,289 per gold equivalent ounce. Year-to-date production is 495,668 gold equivalent ounces at Cost of sales of $1,173 per gold equivalent ounce and AISC of $1,516 per gold equivalent ounce. The Company continues to track towards the lower-end of its production guidance in 2023.
- Solid financial results including robust free cash flow generation: Attributable net income in the third quarter of 2023 was $15.2 million, or $0.07 per diluted share, reflecting one-time tax expenses associated with the previously announced increase of the corporate income tax rate in Türkiye from 20% to 25%. Adjusted attributable net income was $53.0 million, or $0.26 per diluted share. For the nine months ended September 30, 2023, attributable net income was $119.8 million, or $0.57 per diluted share, and adjusted attributable net income was $149.4 million, or $0.70 per diluted share. In the third quarter of 2023, operating cash flow was $135.3 million, or $142.4 million before working capital adjustments, and free cash flow was $87.8 million, or $94.9 million before working capital adjustments. Free cash flow is expected to remain strong in the fourth quarter of 2023, though sales are expected to lag production into year-end given the impact of the holiday season on metal shipments.
- Balance sheet continues to support organic growth initiatives: As of September 30, 2023, SSR Mining had a total cash balance of $437.8 million, reflecting $14.4 million in dividends paid to shareholders and $35.8 million in debt repayments made in the third quarter of 2023. SSR Mining has now extinguished the outstanding balance on its term loan and exited the third quarter of 2023 with a non-GAAP net cash position of $206.9 million and total available liquidity of $937.8 million, supporting the Company’s growth capital commitments over the coming three-year reinvestment period. Subsequent to the quarter, the Board declared a quarterly cash dividend of $0.07 per share to be paid on December 11, 2023. Including the fourth quarter 2023 dividend, the Company is expected to return a minimum of $102.7 million in capital returns in 2023, or a 3.6% yield.
- Revolving credit facility extended: On August 15, 2023, the Company announced that its existing revolving credit facility (the “Second Amended Credit Agreement”) was increased from $200 million to $400 million, with an additional accordion feature of $100 million. The Second Amended Credit Agreement has a renewed term of 4 years, and now matures on August 15, 2027. Under the terms of the increased facility, amounts that are borrowed will incur variable interest at the Secured Overnight Financing Rate plus an applicable margin ranging from 2.00% to 2.75%. The expanded facility will provide the Company with flexibility for working capital and other general corporate purposes.
- Çöpler planned maintenance completed; Çakmaktepe Extension delivers first production in the third quarter: Gold production was 56,768 ounces in the third quarter of 2023 at Cost of sales of $1,190 per ounce and AISC of $1,378 per ounce. Planned maintenance in the Çöpler sulfide plant was completed in the third quarter of 2023, and no further planned maintenance is expected until the fourth quarter of 2024. First ore from the Çakmaktepe Extension project was accessed late in the third quarter of 2023, and initial production from the mine was received at quarter’s end, in line with expectations.
- Record quarterly production at Marigold: Gold production of 83,272 ounces in the third quarter of 2023 was a record at Cost of sales of $980 per ounce and AISC of $1,106 per ounce. During the third quarter of 2023, newly acquired haul trucks intended for stripping activities at Red Dot were reassigned to ore mining in the Mackay pit as the Company focused on the delivery of 2023 guidance. This resequencing is likely to result in delayed access to first ore from Red Dot to the second half of 2024, deferring the associated production into 2025 and 2026.
- Seabee production recovers, grades and throughput to improve further in the fourth quarter: Gold production was 19,823 ounces in the third quarter of 2023 at Cost of sales of $1,026 per ounce and AISC of $1,382 per ounce. Seabee is on track for further production and cost improvement in the fourth quarter of 2023, as grades are forecasted to average between 6.0 g/t and 7.0 g/t in the quarter.
- Puna delivers record quarterly operating performance: Silver production in the third quarter of 2023 was 2.6 million ounces at Cost of sales of $15.23 per ounce of silver and AISC of $13.04 per ounce of silver. Quarterly process plant throughput averaged nearly 4,900 tonnes per day, a record for the mine.
- Exploration programs continue to showcase growth potential across the portfolio: SSR Mining’s significant investment in exploration activities across its operations has continued to yield success indicating potential for Mineral Reserve and Mineral Resource growth across the portfolio. At Seabee, regional exploration activities have focused on the Porky West and Petunia targets with more than 80 holes drilled in 2023, including 46.1 g/t gold over 5.6 meters at Porky West. At Puna’s Cortaderas target, nine holes have returned assay results since the March 2023 exploration update from the mine, including a 190 meter intercept of 155 g/t silver and 10.6% zinc (479 g/t AgEq). SSR Mining has also commenced an infill drilling campaign at Hod Maden with the aim to de-risk the ramp up of initial mining at the project, expected in 2027. The three holes with assays returned to date include a highlight intercept of 90 meters at 16.5 g/t gold and 1.56% copper, reiterating the world class nature of the Hod Maden orebody.
- High-return development projects expected to drive meaningful production growth over the three- to five-year period: SSR Mining is currently reviewing its forward-looking production profile ahead of 2024 and multi-year guidance that will be announced in the first quarter of 2024. A number of low capital intensity, high-return organic growth projects, including Hod Maden, the Red Dot deposit at Marigold and the grind and leach circuit for Çakmaktepe Extension, are expected to drive future production growth. Advancing these projects effectively, as well the resequencing of waste stripping at Marigold and the transition to mining of the Gap Hanging Wall ore body at Seabee, is expected to bring 2024 production below 2023 levels at higher costs.
- Non-core Sunrise Lake exploration property divested: Subsequent to quarter’s end, SSR Mining announced a definitive agreement to sell its Sunrise Lake Property (“Sunrise Lake” or the “Property”) in exchange for a 4.0% net smelter return (“NSR”) royalty on the Property. Under the terms of the agreement, at any time until commencement of construction activities, 2.0% of the NSR royalty can be repurchased by Honey Badger for total consideration of $10 million.
Financial and Operating Highlights
A summary of the Company’s consolidated financial and operating results for the three and nine months ended September 30, 2023 and September 30, 2022 are presented below:
|
|
|
Three Months Ended |
|
Nine Months Ended |
||||||||||||||||
|
(in thousands of US dollars, except per share data) |
|
September 30, |
|
September 30, |
||||||||||||||||
|
|
|
2023 |
|
2022 |
|
2023 |
|
2022 |
||||||||||||
|
Financial Results |
|
|
|
|
|
|
|
|
|
|
|
|
||||||||
|
Revenue |
|
$ |
385,390 |
|
|
$ |
166,627 |
|
|
$ |
1,001,030 |
|
|
$ |
841,656 |
|
||||
|
Cost of sales |
|
$ |
214,670 |
|
|
$ |
106,452 |
|
|
$ |
584,607 |
|
|
$ |
424,900 |
|
||||
|
Operating income |
|
$ |
77,465 |
|
|
$ |
(35,064 |
) |
|
$ |
167,379 |
|
|
$ |
150,901 |
|
||||
|
Net income |
|
$ |
(7,245 |
) |
|
$ |
(28,372 |
) |
|
$ |
144,135 |
|
|
$ |
115,251 |
|
||||
|
Net income attributable to SSR Mining shareholders |
|
$ |
15,159 |
|
|
$ |
(25,793 |
) |
|
$ |
119,838 |
|
|
$ |
100,256 |
|
||||
|
Basic net income per share attributable to SSR Mining shareholders |
|
$ |
0.07 |
|
|
$ |
(0.12 |
) |
|
$ |
0.58 |
|
|
$ |
0.48 |
|
||||
|
Diluted net income per share attributable to SSR Mining shareholders |
|
$ |
0.07 |
|
|
$ |
(0.12 |
) |
|
$ |
0.57 |
|
|
$ |
0.46 |
|
||||
|
Adjusted attributable net income (2) |
|
$ |
53,040 |
|
|
$ |
(13,533 |
) |
|
$ |
149,417 |
|
|
$ |
119,234 |
|
||||
|
Adjusted basic attributable net income per share (2) |
|
$ |
0.26 |
|
|
$ |
(0.07 |
) |
|
$ |
0.73 |
|
|
$ |
0.57 |
|
||||
|
Adjusted diluted attributable net income per share (2) |
|
$ |
0.26 |
|
|
$ |
(0.07 |
) |
|
$ |
0.70 |
|
|
$ |
0.55 |
|
||||
|
|
|
|
|
|
|
|
|
|
|
|
||||||||||
|
Cash generated by operating activities before changes in working capital (2) |
|
$ |
142,350 |
|
|
$ |
(23,666 |
) |
|
$ |
337,484 |
|
|
$ |
212,703 |
|
||||
|
Cash generated by operating activities |
|
$ |
135,256 |
|
|
$ |
(52,226 |
) |
|
$ |
218,566 |
|
|
$ |
42,799 |
|
||||
|
Cash used in investing activities |
|
$ |
(48,470 |
) |
|
$ |
(12,238 |
) |
|
$ |
(280,211 |
) |
|
$ |
(69,983 |
) |
||||
|
Cash used in financing activities |
|
$ |
(46,672 |
) |
|
$ |
(121,951 |
) |
|
$ |
(157,806 |
) |
|
$ |
(238,634 |
) |
||||
|
|
|
|
|
|
|
|
|
|
|
|
||||||||||
|
Operating Results |
|
|
|
|
|
|
|
|
|
|
||||||||||
|
Gold produced (oz) |
|
|
|
159,863 |
|
|
|
|
76,462 |
|
|
|
|
411,587 |
|
|
|
|
368,972 |
|
|
Gold sold (oz) |
|
|
|
161,227 |
|
|
|
|
72,035 |
|
|
|
|
412,254 |
|
|
|
|
375,543 |
|
|
Silver produced (‘000 oz) |
|
|
|
2,645 |
|
|
|
|
2,738 |
|
|
|
|
6,930 |
|
|
|
|
6,008 |
|
|
Silver sold (‘000 oz) |
|
|
|
2,852 |
|
|
|
|
2,234 |
|
|
|
|
7,090 |
|
|
|
|
5,766 |
|
|
Lead produced (‘000 lb) (3) |
|
|
|
10,403 |
|
|
|
|
11,390 |
|
|
|
|
31,957 |
|
|
|
|
27,582 |
|
|
Lead sold (‘000 lb) (3) |
|
|
|
11,707 |
|
|
|
|
9,169 |
|
|
|
|
34,882 |
|
|
|
|
28,255 |
|
|
Zinc produced (‘000 lb) (3) |
|
|
|
1,577 |
|
|
|
|
1,590 |
|
|
|
|
5,805 |
|
|
|
|
4,940 |
|
|
Zinc sold (‘000 lb) (3) |
|
|
|
1,454 |
|
|
|
|
1,050 |
|
|
|
|
6,174 |
|
|
|
|
5,546 |
|
|
|
|
|
|
|
|
|
|
|
|
|
||||||||||
|
Gold equivalent produced (oz) (3) |
|
|
|
192,195 |
|
|
|
|
106,919 |
|
|
|
|
495,668 |
|
|
|
|
441,164 |
|
|
Gold equivalent sold (oz) (3) |
|
|
|
196,088 |
|
|
|
|
96,885 |
|
|
|
|
498,284 |
|
|
|
|
444,827 |
|
|
|
|
|
|
|
|
|
|
|
|
|
||||||||||
|
Average realized gold price ($/oz sold) |
|
$ |
1,913 |
|
|
$ |
1,691 |
|
|
$ |
1,925 |
|
|
$ |
1,836 |
|
||||
|
Average realized silver price ($/oz sold) |
|
$ |
21.99 |
|
|
$ |
16.75 |
|
|
$ |
23.14 |
|
|
$ |
19.82 |
|
||||
|
|
|
|
|
|
|
|
|
|
|
|
||||||||||
|
Cost of sales per gold equivalent ounce sold (4) |
|
$ |
1,095 |
|
|
$ |
1,099 |
|
|
$ |
1,173 |
|
|
$ |
955 |
|
||||
|
Cash cost per gold equivalent ounce sold (2, 4) |
|
$ |
1,046 |
|
|
$ |
1,051 |
|
|
$ |
1,114 |
|
|
$ |
891 |
|
||||
|
AISC per gold equivalent ounce sold (2, 4) |
|
$ |
1,289 |
|
|
$ |
1,901 |
|
|
$ |
1,516 |
|
|
$ |
1,331 |
|
||||
|
|
|
|
|
|
|
|
|
|
|
|
|
|
||||||||
|
Financial Position |
|
September 30, 2023 |
|
December 31, 2022 |
||||||||||||||||
|
Cash and cash equivalents |
|
$ |
|
|
437,675 |
|
|
$ |
|
|
655,453 |
|
||||||||
|
Current assets |
|
$ |
|
|
1,157,979 |
|
|
$ |
|
|
1,376,435 |
|
||||||||
|
Total assets |
|
$ |
|
|
5,749,660 |
|
|
$ |
|
|
5,254,657 |
|
||||||||
|
Current liabilities |
|
$ |
|
|
166,145 |
|
|
$ |
|
|
279,252 |
|
||||||||
|
Total liabilities |
|
$ |
|
|
1,156,545 |
|
|
$ |
|
|
1,128,458 |
|
||||||||
|
Working capital (5) |
|
$ |
|
|
991,834 |
|
|
$ |
|
|
1,097,183 |
|
||||||||
(2) The Company reports non-GAAP financial measures including adjusted attributable net income, adjusted attributable net income per share, cash generated by operating activities before changes in working capital, cash costs and AISC per ounce sold to manage and evaluate its operating performance at its mines. See “Non-GAAP Financial Measures” at the end of this press release for an explanation of these financial measures and a reconciliation of these financial measures to net income (loss) attributable to SSR Mining shareholders, Cost of sales, and cash generated by operating activities, which are the most comparable GAAP financial measures. Cost of sales excludes depreciation, depletion, and amortization.
(3) Data for lead production and sales relate only to lead in lead concentrate. Data for zinc production and sales relate only to zinc in zinc concentrate.
(4) Gold equivalent ounces are calculated by multiplying the silver ounces by the ratio of the silver price to the gold price, using the average London Bullion Market Association (“LBMA”) prices for the period. The Company does not include by-products in the gold equivalent ounce calculations.
(5) Working capital is defined as current assets less current liabilities.
|
Çöpler, Türkiye |
||||||||||||
|
(amounts presented on 100% basis) |
||||||||||||
|
|
|
Three Months Ended |
|
Nine Months Ended |
||||||||
|
|
|
September 30, |
|
September 30, |
||||||||
|
Operating Data |
|
2023 |
|
2022 |
|
2023 |
|
2022 |
||||
|
Gold produced (oz) |
|
|
56,768 |
|
|
3,733 |
|
|
163,873 |
|
|
125,763 |
|
Gold sold (oz) |
|
|
58,694 |
|
|
2,591 |
|
|
165,905 |
|
|
132,862 |
|
|
|
|
|
|
|
|
|
|
|
|
|
|
|
Ore mined (kt) |
|
|
915 |
|
|
70 |
|
|
3,278 |
|
|
1,754 |
|
Waste removed (kt) |
|
|
7,448 |
|
|
406 |
|
|
17,664 |
|
|
11,715 |
|
Total material mined (kt) |
|
|
8,363 |
|
|
476 |
|
|
20,942 |
|
|
13,469 |
|
Strip ratio |
|
|
8.1 |
|
|
5.8 |
|
|
5.4 |
|
|
6.7 |
|
|
|
|
|
|
|
|
|
|
|
|
|
|
|
Ore stacked (kt) |
|
|
289 |
|
|
— |
|
|
631 |
|
|
210 |
|
Gold grade stacked (g/t) |
|
|
1.47 |
|
|
— |
|
|
1.40 |
|
|
0.87 |
|
|
|
|
|
|
|
|
|
|
|
|
|
|
|
Ore milled (kt) |
|
|
618 |
|
|
64 |
|
|
2,022 |
|
|
1,320 |
|
Gold mill feed grade (g/t) |
|
|
2.92 |
|
|
2.27 |
|
|
2.56 |
|
|
2.91 |
|
Gold recovery (%) |
|
|
85.1 |
|
|
86.0 |
|
|
87.2 |
|
|
87.1 |
|
|
|
|
|
|
|
|
|
|
|
|
|
|
|
Average realized gold price ($/oz sold) |
|
$ |
1,928 |
|
$ |
1,641 |
|
$ |
1,930 |
|
$ |
1,864 |
|
Cost of sales ($/oz gold sold) |
|
$ |
1,190 |
|
$ |
118 |
|
$ |
1,202 |
|
$ |
948 |
|
Cash costs ($/oz gold sold) (6) |
|
$ |
1,167 |
|
$ |
160 |
|
$ |
1,186 |
|
$ |
928 |
|
AISC ($/oz gold sold) (6) |
|
$ |
1,378 |
|
$ |
14,972 |
|
$ |
1,397 |
|
$ |
1,351 |
(6) The Company reports the non-GAAP financial measures of cash costs and AISC per ounce of gold sold to manage and evaluate operating performance at Çöpler. See “Non-GAAP Financial Measures” for an explanation of these financial measures and a reconciliation to Cost of sales, which are the comparable GAAP financial measure. Cost of sales excludes depreciation, depletion, and amortization.
For the three months ended September 30, 2023 and 2022, Çöpler produced 56,768 and 3,733 ounces of gold, respectively. For the nine months ended September 30, 2023 and 2022, Çöpler produced 163,873 and 125,763 ounces of gold, respectively. Third quarter 2023 Cost of sales of $1,190 per ounce and AISC of $1,378 per ounce reflected normal course costs associated with the planned maintenance of the sulfide plant that was completed in the quarter.
The Çakmaktepe Extension project accessed first ore in the third quarter of 2023, and subsequently delivered first production in late September 2023. Çakmaktepe Extension remains on track to produce 10,000 to 15,000 ounces of gold in the fourth quarter 2023.
|
Marigold, USA |
||||||||||||
|
|
|
Three Months Ended |
|
Nine Months Ended |
||||||||
|
|
|
September 30, |
|
September 30, |
||||||||
|
Operating Data |
|
2023 |
|
2022 |
|
2023 |
|
2022 |
||||
|
Gold produced (oz) |
|
|
83,272 |
|
|
52,236 |
|
|
195,694 |
|
|
131,793 |
|
Gold sold (oz) |
|
|
83,103 |
|
|
49,744 |
|
|
194,789 |
|
|
132,681 |
|
|
|
|
|
|
|
|
|
|
|
|
|
|
|
Ore mined (kt) |
|
|
7,732 |
|
|
4,279 |
|
|
18,141 |
|
|
13,200 |
|
Waste removed (kt) |
|
|
16,329 |
|
|
15,922 |
|
|
49,007 |
|
|
56,286 |
|
Total material mined (kt) |
|
|
24,061 |
|
|
20,201 |
|
|
67,148 |
|
|
69,486 |
|
Strip ratio |
|
|
2.1 |
|
|
3.7 |
|
|
2.7 |
|
|
4.3 |
|
|
|
|
|
|
|
|
|
|
|
|
|
|
|
Ore stacked (kt) |
|
|
7,732 |
|
|
4,279 |
|
|
18,141 |
|
|
13,200 |
|
Gold grade stacked (g/t) |
|
|
0.45 |
|
|
0.59 |
|
|
0.46 |
|
|
0.54 |
|
|
|
|
|
|
|
|
|
|
|
|
|
|
|
Average realized gold price ($/oz sold) |
|
$ |
1,908 |
|
$ |
1,692 |
|
$ |
1,923 |
|
$ |
1,797 |
|
Cost of sales costs ($/oz gold sold) |
|
$ |
980 |
|
$ |
1,079 |
|
$ |
1,027 |
|
$ |
1,077 |
|
Cash costs ($/oz gold sold) (7) |
|
$ |
981 |
|
$ |
1,081 |
|
$ |
1,029 |
|
$ |
1,078 |
|
AISC ($/oz gold sold) (7) |
|
$ |
1,106 |
|
$ |
1,444 |
|
$ |
1,423 |
|
$ |
1,482 |
(7) The Company reports the non-GAAP financial measures of cash costs and AISC per ounce of gold sold to manage and evaluate operating performance at Marigold. See “Non-GAAP Financial Measures” for an explanation of these financial measures and a reconciliation to Cost of sales, which are the comparable GAAP financial measure. Cost of sales excludes depreciation, depletion, and amortization.
For the three months ended September 30, 2023 and 2022, Marigold produced 83,272 and 52,236 ounces of gold, respectively. For the nine months ended September 30, 2023 and 2022, Marigold produced 195,694 and 131,793 ounces of gold, respectively. Third quarter 2023 Cost of sales were $980 per ounce and AISC were $1,106 per ounce.
During the third quarter of 2023, newly acquired haul trucks intended for stripping activities at Red Dot were reassigned to ore mining in the Mackay pit as the Company focused on the delivery of 2023 guidance. This resequencing is likely to result in delayed access to first ore from Red Dot to the second half of 2024, deferring the associated production into 2025 and 2026.
|
Seabee, Canada |
||||||||||||
|
|
|
Three Months Ended |
|
Nine Months Ended |
||||||||
|
|
|
September 30, |
|
September 30, |
||||||||
|
Operating Data |
|
2023 |
|
2022 |
|
2023 |
|
2022 |
||||
|
Gold produced (oz) |
|
|
19,823 |
|
|
20,493 |
|
|
52,020 |
|
|
111,416 |
|
Gold sold (oz) |
|
|
19,430 |
|
|
19,700 |
|
|
51,560 |
|
|
110,000 |
|
|
|
|
|
|
|
|
|
|
|
|
|
|
|
Ore mined (kt) |
|
|
108 |
|
|
108 |
|
|
326 |
|
|
307 |
|
|
|
|
|
|
|
|
|
|
|
|
|
|
|
Ore milled (kt) |
|
|
105 |
|
|
101 |
|
|
323 |
|
|
295 |
|
Gold mill feed grade (g/t) |
|
|
6.17 |
|
|
6.07 |
|
|
5.29 |
|
|
11.84 |
|
Gold recovery (%) |
|
|
96.5 |
|
|
97.3 |
|
|
96.5 |
|
|
98.2 |
|
|
|
|
|
|
|
|
|
|
|
|
|
|
|
Average realized gold price ($/oz sold) |
|
$ |
1,884 |
|
$ |
1,693 |
|
$ |
1,915 |
|
$ |
1,849 |
|
Cost of sales ($/oz gold sold) |
|
$ |
1,026 |
|
$ |
908 |
|
$ |
1,192 |
|
$ |
485 |
|
Cash costs ($/oz gold sold) (8) |
|
$ |
1,027 |
|
$ |
910 |
|
$ |
1,193 |
|
$ |
486 |
|
AISC ($/oz gold sold) (8) |
|
$ |
1,382 |
|
$ |
1,304 |
|
$ |
1,742 |
|
$ |
735 |
(8) The Company reports the non-GAAP financial measures of cash costs and AISC per ounce of gold sold to manage and evaluate operating performance at Seabee. See “Non-GAAP Financial Measures” for an explanation of these financial measures and a reconciliation to Cost of sales, which are the comparable GAAP financial measure. Cost of sales excludes depreciation, depletion, and amortization.
For the three months ended September 30, 2023 and 2022, Seabee produced 19,823 and 20,493 ounces of gold, respectively. For the nine months ended September 30, 2023 and 2022, Seabee produced 52,020 and 111,416 ounces of gold, respectively. Improved production resulted in third quarter 2023 Cost of sales of $1,026 per ounce and AISC of $1,382 per ounce.
SSR Mining continues to invest significantly in near-mine and regional exploration at Seabee as the Company seeks to extend the existing Mineral Reserve life of the operation. In 2023, drilling at the Porky West and Petunia targets has been a focus for the resource development team. In Seabee’s 2021 Technical Report Summary, Porky West hosted approximately 8,000 ounces of Indicated Mineral Resources and approximately 73,000 ounces of Inferred Mineral Resources. Since that time, exploration has focused on step-out and expansion drilling across the greater Porky target area with success.
At present, mineralization at Porky West has been identified to 500 meters of vertical depth and remains open down plunge. Incorporating both Porky West and the Petunia target, mineralization has been identified along 1,250 meters of strike and remains open in both directions.
Contacts
SSR Mining:
F. Edward Farid, Executive Vice President, Chief Corporate Development Officer
Alex Hunchak, Director, Corporate Development and Investor Relations
SSR Mining Inc.
E-Mail: [email protected]
Phone: +1 (888) 338-0046
To receive SSR Mining’s news releases by e-mail, please register using the SSR Mining website at www.ssrmining.com.

