Empire Metals Limited – MRE Confirms World Dominant Titanium Discovery
Posted on October 14th, 2025 | Filed under Press Releases
Mineral Resource Estimate Confirms Pitfield’s World Dominant Titanium Discovery
LONDON, UNITED KINGDOM / ACCESS Newswire / October 14, 2025 / Empire Metals Limited, the AIM-quoted and OTCQX-traded exploration and development company, is pleased to report a maiden Mineral Resource Estimate (‘MRE’) at its Pitfield Project in Western Australia (‘Pitfield’ or the ‘Project’). The MRE is reported in accordance with the Joint Ore Reserves Committee (‘JORC’) 2012 Code (The Australasian Code for Reporting of Exploration Results, Mineral Resources, and Ore Reserves) and includes both Indicated and Inferred categories.
Highlights
One of the largest and highest-grade titanium resources reported globally1, totalling:
2.2 billion tonnes grading 5.1% TiO2 for 113 million tonnes of contained TiO2
The MRE is reported only for Pitfield’s Thomas and Cosgrove deposits, and contains an in-situ Weathered Zone, inclusive of both the saprolite and weathered bedrock, of:
1.26 billion tonnes grading 5.2% TiO2 for 65.6 million tonnes of contained TiO2
The MRE also includes a significant Indicated Resource category, predominantly at the Thomas deposit, of:
697 million tonnes grading 5.3% TiO2 for 37.2 million tonnes contained TiO2
Multi-generational mine life: the Thomas and Cosgrove deposits that contain the MRE extend over 39km2 and 20km2 respectively, however they represent less than 20% of the known mineralised surface area. The underlying geophysical anomaly extends for kilometres below the extent of the current depth of drilling.
High-grade, high-purity titanium mineralisation: occurs from surface, showing exceptional grade continuity along strike and down dip.
Rapid Product Development Success: Conventional processing has already produced a high-purity product grading 99.25% TiO2 with negligible impurities, suitable for titanium sponge metal or pigment production.
Friable, in-situ weathered zone: contains naturally forming TiO2 minerals, anatase and rutile, suitable for low-cost strip mining, with no overburden, no inter-burden, and no blasting required.
Drilling at Thomas has defined a large, high-grade central core averaging circa 6% TiO2 across a continuous 3.6km strike length and over 2km width, expected to provide sufficient feedstock for over 30 years of initial mine life.
Further resource expansion planned: additional drilling is expected to increase the size of the maiden MRE and upgrade portions of the resource into Measured and Indicated categories.
Strategically located with access to global markets: Pitfield benefits from excellent logistics, with existing rail links to deep-water ports providing direct shipping access to Asia, USA, Europe and Saudi Arabia, ensuring secure and efficient delivery to global titanium and critical mineral markets.
1US Geological Survey, 2025 Summary Sheets, World Resources of Titanium Minerals.
Shaun Bunn, Managing Director, said:“Pitfield is truly one of the natural geological wonders of the world: a district scale, giant titanium rich ore deposit which has remained hidden in plain sight until recently discovered by Empire. Credit goes to our talented exploration and technical team who have delivered one of the world’s largest titanium MRE, a metallurgical flowsheet and a saleable product, all within a remarkable short period of 30 months from our first drill hole.
“The incredible success achieved to date has only spurred our team’s endeavours to untap the true potential of this phenomenal project and we remain focused on completing our processing optimisation testwork and moving rapidly into continuous piloting early next year. We have already commenced engineering, environmental and marketing studies which combined, will help confirm the commercial viability of Pitfield and form the basis for a Final Investment Decision.”
Pitfield Mineral Resource Statement (100% basis)
The Pitfield MRE incorporates the titanium mineralisation hosted within the interbedded succession of sandstones, siltstones and conglomerates as delineated through Diamond Core (‘DD’), Reverse Circulation (‘RC’) and Aircore (AC) drilling, that is supplemented with geophysical surveys, surface mapping and soil and rock chip sampling.
The Pitfield MRE is being reported in accordance with the 2012 JORC Code and estimated by a Competent Person as defined by the Code. The Pitfield MRE contains a high percentage of Indicated category, highlighting the confidence level of the resource within the maiden statement.
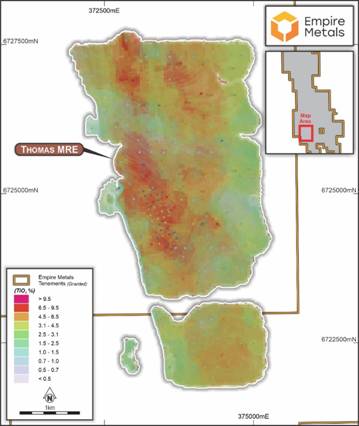
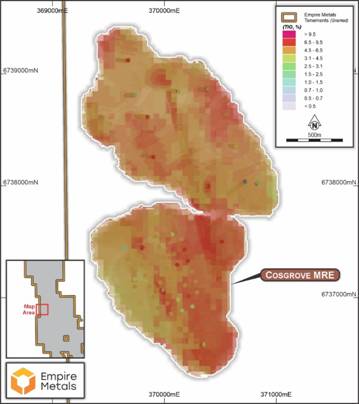
Notably, the MRE consists of two, distinct, high-grade, near-surface, in-situ weathered bedrock zones referred to as the Thomas and Cosgrove Deposits, which are defined by an area of 11.75km2 and 2.9km2 respectively (refer Figure 2). The MRE is within the larger Thomas and Cosgrove prospect areas of a combined area of 59km2.
The MRE has been subdivided to show the potential mineralisation at each prospect separately. It has been further subdivided to show the range of mineralisation within the in-situ saprolite zone and weathered bedrock zones, both being enriched in titanium dioxide minerals (anatase and rutile) and extending from surface to an average depth of approximately 30m to 50m (Table 1). Additionally, the MRE includes the uppermost portion of the underlying fresh bedrock mineralisation, which is primarily enriched with the titanium mineral titanite, as well as some rutile and titanium-iron oxides, and is completely open at depth.
Table 1 below summarises the MRE for Pitfield’s Thomas and Cosgrove deposits effective as of 13 October 2025 on a 100% basis. Empire owns 70% of Pitfield in a Joint Venture (JV) with Century Minerals Pty Ltd, which holds the remaining 30% JV interest. Empire is manager of the JV and the sole operator of the Project. Snowden Optiro was engaged to prepare a geological resource model for the MRE for Empire on the Pitfield Project. The MRE was reviewed and signed off in accordance with the JORC Code (2012) by Andrew Faragher (MAusIMM), Exploration Manager for Empire.
Table 1. Pitfield Project Mineral Resource Statement
Mineral Resource Estimate for the Thomas Deposit, Pitfield – October 2025
Domain
Cut-Off
Indicated
Inferred
Total Mineral Resource
Material Type
TiO2 (%)
Tonnes (Mt)
Grade (%)
Tonnes (kt)
Tonnes (Mt)
Grade (%)
Tonnes (kt)
Tonnes (Mt)
Grade (%)
TiO2
Tonnes (kt)
Laterite
2.5
33
3.0
1,000
20
5.0
1,000
53
3.8
2,000
Saprolite
95
5.3
5,000
70
4.3
3,000
165
4.8
8,000
Weathered
461
5.4
25,000
460
4.8
22,000
921
5.1
47,000
Fresh
52
5.8
3,000
580
4.8
28,000
632
4.9
31,000
Total
641
5.3
34,000
1,130
4.8
54,000
1,770
5.0
88,000
Mineral Resource Estimate for the Cosgrove Deposit, Pitfield – October 2025
Domain
Cut-Off
Indicated
Inferred
Total Mineral Resource
Material Type
TiO2 (%)
Tonnes (Mt)
Grade (%)
Tonnes (kt)
Tonnes (Mt)
Grade (%)
Tonnes (kt)
Tonnes (Mt)
Grade (%)
TiO2
Tonnes (kt)
Laterite
2.5
1.2
5.8
70
7
5.8
406
8
5.8
476
Saprolite
11
6.4
700
15
6.0
900
26
6.2
1,600
Weathered
35
5.7
2,000
111
6.3
7,000
146
6.2
9,000
Fresh
9
5.3
480
240
5.4
13,000
249
5.4
13,480
Total
56
5.8
3,250
373
5.7
21,306
430
5.8
24,556
Combined Mineral Resource Estimates for the Pitfield Project – October 2025
Domain
Cut-Off
Indicated
Inferred
Total Mineral Resource
Material Type
TiO2 (%)
Tonnes (Mt)
Grade (%)
Tonnes (kt)
Tonnes (Mt)
Grade (%)
Tonnes (kt)
Tonnes (Mt)
Grade (%)
TiO2
Tonnes (kt)
Laterite
2.5
34
3.1
1,070
27
3.1
1,406
61
4.0
2,476
Saprolite
106
5.4
5,700
85
5.4
3,900
191
5.0
9,600
Weathered
496
5.4
27,000
571
5.4
29,000
1,067
5.2
56,000
Fresh
61
5.7
3,480
820
5.7
41,000
881
5.0
44,480
Total
697
5.3
37,250
1,503
5.0
75,306
2,200
5.1
112,556
Notes:
The preceding statements of Mineral Resources conforms to the Australasian Code for Reporting of Exploration Results, Mineral Resources and Ore Reserves (JORC Code) 2012 Edition. All tonnages reported are dry metric tonnes. Minor discrepancies occur due to rounding to appropriate significant figures. The MRE is reported above a 2.5% TiO2 cut-off, constrained to aReasonable Prospects for Eventual Economic Extraction (RPEEE)pitshell.
About the Pitfield Project
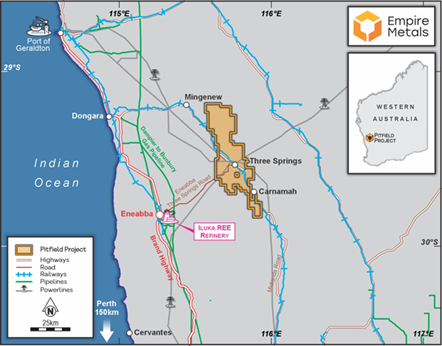
Located within the Mid-West region of Western Australia, near the northern wheatbelt town of Three Springs, the Pitfield titanium project lies 313km north of Perth and 156km southeast of Geraldton, the Mid West region’s capital and major port. Western Australia is a Tier 1 mining jurisdiction, with mining-friendly policies, stable government, transparency, and advanced technology expertise. Pitfield has existing connections to port (both road & rail), HV power substations, and is nearby to natural gas pipelines as well as a green energy hydrogen fuel hub, which is under planning and development (refer Figure 1).
Figure 1. Pitfield Project Location showing theMid-West Region Infrastructure and Services
Thomas and Cosgrove MRE
The MRE has been completed on the Thomas and Cosgrove Deposits, which are located approximately 10km south-west and north-west of the town of Three Springs respectively. The Thomas Deposit has significantly more drill holes then the Cosgrove Deposit, due to the extensive drilling programme that was completed there in July 2025 (announced 8 July 2025). The greater drilling density at Thomas has resulted in a far larger MRE at Thomas than at Cosgrove, however further MRE grid drilling (AC/RC) is planned at Cosgrove over the next six months. Further infill MRE drilling at the Thomas Deposit (AC/RC) is scheduled for Q1/Q2 CY 2026 with drill holes to be drilled on existing cleared track lines within native vegetation areas under a standard clearance permit, while diamond drilling is scheduled in Q4 CY 2025 at Thomas focused on metallurgical and geotechnical work.
It is important to note that the maiden MRE presented herein is constrained by only the current number and density of drill holes and not currently by geology or extent of TiO2 mineralisation. Additional resource development drilling is planned that is fully anticipated to both enlarge this maiden MRE but also provide for more higher confidence category tonnages, including both Measured and Indicated categories. This maiden MRE provides, without constraint, the basis for the preliminary engineering and economic studies that are underway.
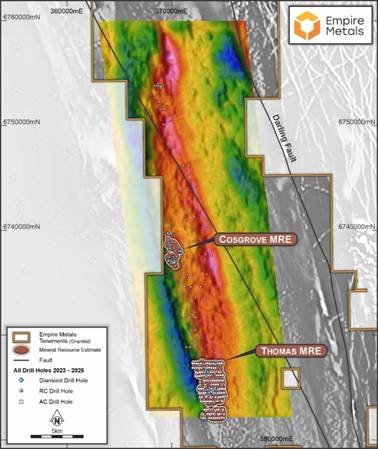
Figure 2: MRE outlines for Thomas and Cosgrove Deposits with background images of airborne gravity survey results with the location of the AC, RC and DD drillholes
Geology and Mineralisation Style
Pitfield lies in a unique geological setting along the western boundary of the Yilgarn Craton, within the Yandanooka Basin which consists mainly of interbedded sandstones, siltstone and conglomerates. The Basin is situated between the Eurella Fault to the west and the Darling Range Fault to the east, and is interpreted to be approximately 9km deep. Crustal mapping by Geoscience Australia shows there are several deep crustal faults intersecting beneath the Yandanooka Basin and these faults are potentially the conduits of hydrothermal fluids that have strongly altered the host sediments and provided an upgrade to the titanium mineralisation.
The titanium mineralisation is associated predominantly with anatase and rutile in the weathered cap and titanite and rutile in the underlying fresh bedrock. Three distinct events have controlled the formation and nature of the titanium mineralisation. A Ti-rich magmatic intrusion was initially formed, uplifted and eroded into a shallow basin whereby titanium minerals were concentrated into beds as the sediments were sorted by a natural density-based segregation on a significantly larger extent than occurs in surficial mineral sand type deposits. A subsequent hydrothermal event and regional greenschist metamorphism then altered the host sediments and titanium minerals within the sediments and produced an alteration assemblage dominated by titanite (CaTiSiO5), hematite, epidote, carbonate and chlorite. The titanium mineralisation was further upgraded by intense weathering altering the titanite to anatase by removal of the calcium and silica. The consequence of this geological history has been the upgrading of TiO2 content in the ore mineralogy ultimately to >95% TiO2 in the anatase found in the weathered cap. Uniquely, nature has in fact done much of the processing for Empire at Pitfield.
The mineralisation is completely stratabound and the best mineralisation is found within the weathered cap whereby the sandstones, siltstone and conglomerates have been altered to saprolite, predominantly quartz and kaolin and the titanite has altered to anatase (TiO2). The weathered bedrock consists of altered rock, but weathering is less intense, quartz and kaolin are predominant but as the weathering profile turns to fresher material there is an increase in chlorite, epidote, mica, hematite and carbonate; the anatase content decreases and the titanite content increases.
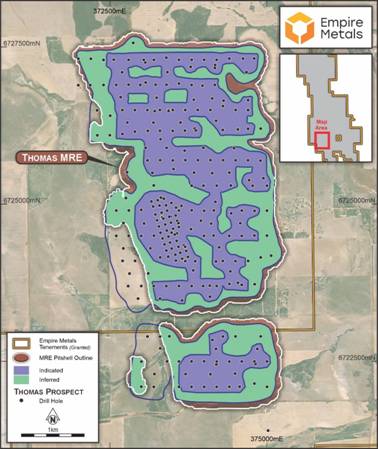
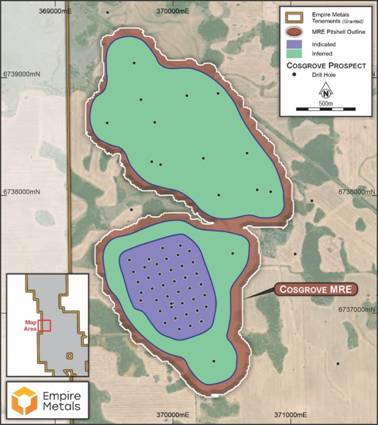
The Pitfield MRE incorporates the Thomas and Cosgrove Deposits. Both Thomas and Cosgrove deposits (see Figures 2, 3 & 4) have near-surface, high-grade mineralisation that contains significant quantities of Indicated Mineral Resources. Thomas and Cosgrove both have large, high-grade central cores as per the Block Model. This in-situ weathered cap at Thomas alone would be sufficient to provide adequate feed for the first of several generational mine lives.
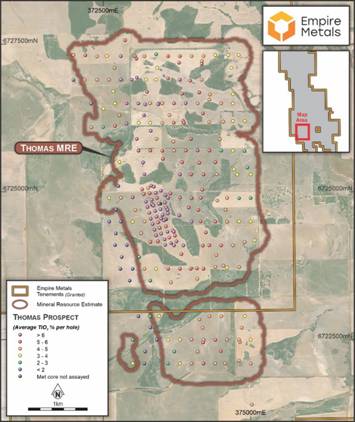
Figure 3. Thomas Deposit: Location with MRE outline and drill collars
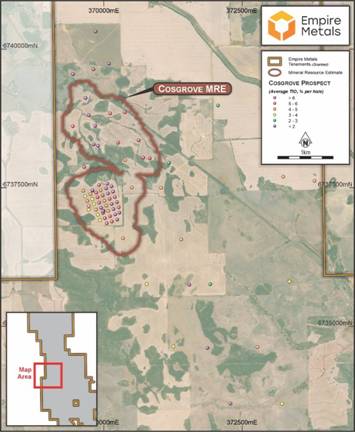
Figure 4. Cosgrove Deposit: Location with MRE outline and drill collars
Drilling Techniques
Drilling was undertaken between 2023 and 2025 with all drilling managed entirely by Empire using contractors. RC holes were drilled at a diameter of 146mm, AC holes were drilled at a diameter of 90mm or 76mm. Diamond core holes were drilled using PQ3 (85mm,) HQ3 (61mm) or NQ2 (51mm) equipment. Drill core was oriented using the industry standard Reflex orientation tool.
Twin drilling was conducted between five drillhole pairs for a comparison of air core to both diamond and reverse circulation with little difference between the grade of the RC and AC twin drillholes.
Table 2: Drilling (drillholes with assays) metrics by prospect, year and hole type
Thomas
Cosgrove
Other Areas
Year
Hole Type
Count
Metres
Count
Metres
Count
Metres
2023
RC
11
1,712
13
1,848
36
5,343
DD
1
408
1
400
1
408
2024
RC
19
2,926
20
3,006
1
154
DD
7
771
7
715
2025
AC
183
8,679
42
2111
RC
40
3,776
Totals
261
18,271
83
8,080
38
5,905
Since commencing the maiden drilling campaign at Pitfield on 27 March 2023, Empire has completed 382 drill holes for a total 32,256 metres comprising:
17 DD drill holes for 2,704 m
140 RC drill holes for 18,764 m
225 AC drill holes for 10,797 m.
Sampling Techniques
Sampling at Thomas and Cosgrove utilised standard procedures employed across all drilling methods, with samples considered representative for the purposes of reporting.
Air core (AC) samples were collected directly from an AC drill rig using a cone splitter at intervals every 2m downhole.
Reverse circulation (RC) samples were collected directly from an RC drill rig using a cone splitter at intervals every 2m downhole.
Diamond core samples were taken from the diamond core (HQ and NQ) that was sawn in half, with half going for assay and other half retained in core tray. Hole drilled with PQ, predominantly for metallurgical samples, were cut in half and then one half cut in quarter. The quarter was sent for assay and the remaining three quarters retained for metallurgical sampling. Samples were taken based on the geological logging of the drill holes.
Sample Preparation and Assay
Sample preparation for all AC, RC and DD samples was undertaken at Intertek Minerals laboratory in Maddington WA, where the samples received were sorted and dried. Primary preparation for diamond core samples was to crush each sample in its entirety to 3mm. AC and RC samples were primarily crushed to 3mm. Larger volume samples (>5kg) were split with a riffle splitter. All samples were pulverised via robotic pulveriser. Internal screen sizing QAQC is done at 90% passing 75um.
Prior to October 2024 a 4-acid digestion was used with ICP-MS finish (procedure 4A/MS48) as the initial assay technique. If the initial Ti values exceeded 2% Ti, the samples were re-assayed using a borate fusion digestion to ensure complete dissolution of Ti-bearing minerals, with a ICP-OES analytical finish (procedure FP1/OM).
In October 2024 the analytical methodology was modified to reduce the number of initial elements analysed to 33. The samples underwent a 4-acid digestion and were analysed by ICP-OES finish (procedure 4A/OE33). All samples with initial values exceeding 2% Ti were analysed again with an ICP-OES finish, but with a borate fusion digestion to ensure complete sample dissolution and total TiO2 mineral assaying.
Certified analytical standards were inserted with sample numbers ending in 00, 25, 50 and 75 within the numbering sequence for all AC, RC and DD samples.
Duplicates were inserted with sample numbers ending in 20, 40, 60 and 80 sample numbers within the numbering sequence for all AC and RC samples.
Bulk Density
A total of 42 bulk density values were collected from diamond drill core from both Thomas and Cosgrove; the samples came from the saprolite, weathered bedrock and fresh bedrock zones and were sent to Terra Petrophysics in O’Connor, Perth. The density determinations were made using conventional laboratory procedures. The buoyancy (specific gravity) method is used to determine bulk rock densities, after the samples are saturated with distilled water for 24 hours. Dry bulk densities are determined by dry weight divided by the buoyancy determined volume of each sample. Porosities are calculated from water saturated weights, dry weights, and the buoyancy-determined volume.
The accuracy of the buoyancy technique of density measurement is better than 0.1 grams per cubic centimetre. The results of the laboratory density determinations are reported in grams per cubic centimetre.
Estimation Methodology
Geological interpretation was completed using Leapfrog Geo (v 2025.2.1) software to construct a material type (cover, saprolite, weathered and fresh rock domains) model, which used a combination of geological logging and element geochemical data. A further geological model representing the principle lithological units was constructed using logging codes to represent the Yandanooka sandstone and interbedded conglomerate units present at both deposits. Mineralisation domains were defined using a lower modelling cut-off approximating a 2% TiO2 threshold, with a clear northwest-southeast trending boundary striking through both the Cosgrove and Thomas deposits.
Exploratory data analysis was then conducted by reviewing multi-element geochemical relationships for TiO2 with Al, Fe, Ca, Mg, K and Na in each of the forementioned domains. Estimation domains were defined based on weathering intensity and above and below the TiO2 modelling cut-off.
Drillholes were composited to 2m increments, representing the typical sampling interval used. Geostatistical analysis and grade continuity modelling was reviewed using Datamine’s Snowden Supervisor Software (v8.15.2) and estimation conducted using Datamine’s Studio RM Pro (v2.1.125.0).
The TiO2 grade was estimated using ordinary kriging, employing a three-pass estimation strategy within parent blocks measuring 50 m(X) by 50 m(Y) by 10 m(RL). Sub-blocking was permitted to 2m in all directions.
Variograms were modelled separately for each deposit using normal scores transformed data, which was back-transformed on export. At Thomas, the nugget effect was modelled at <20% of total variance, with the remaining three structures modelled at 155m (0.31), 285m (0.11), and 535m (0.41). The variogram is aligned 000->345 for the major direction, 00->255 for the semi-major and 90->000 for the minor (vertical). Cosgrove has less data outside of the closely spaced drill area. At Cosgrove, the nugget effect accounted for approximately 25% of variance of the data. The remaining two structures were modelled at 125m (0.316) and 375m (0.435). The orientations were like Thomas, however favoured a slight rotation of the major to 00->340 was used, with 00->070 for the semi-major and 90->00 for the minor.
Density was assigned to the parent blocks based on bulk densities determined form the Archimedes water immersion method, conducted at Terra Resources. A total of 40 samples from both deposits were submitted across all weathering types. Density were assigned to the block model on the basis of material type, as per Table 3 below.
Table 3: Bulk densities applied at Cosgrove and Thomas deposits
Material type
Number of samples
Mean bulk density t/m3
Applied bulk density t/m3
Cover (sand)
1
2.06
1.70
Laterite
1
1.78
1.78
Saprolite
6
2.02
2.02
Weathered sandstone
25
2.14
2.14
Fresh sandstone/conglomerate
7
3.07
3.07
Due to the size of the deposits, any un-estimated blocks were hard-coded and were flagged in the model by way of an indicator variable and excluded from classified Mineral Resources.
Figure 5. Thomas Deposit: MRE Block Model highlighting high grade core.
Figure 6. Cosgrove Deposit: MRE Block Model highlighting high grade zones.
Cut-off grade(s) and basis of selection
A cut-off grade of 2.5% TiO2 was used and determined from optimisation studies which indicated a break-even cut-off of 2.36% TiO2. Grade and tonnes have been reported within a constrained pit shell reported from a Whittle optimisation. The underlying parameters are listed in Table 4.
This decision was based on a high-level preliminary evaluation of potential modifying factors.
Table 4: Open pit RPEEE optimisation inputs
Item
Units
Value
Comment
Factors
Dilution
%
0
Snowden Optiro assumption – bulk commodity
Mining recovery
%
100
Snowden Optiro assumption – bulk commodity
Process recovery
%
70
Empire provided data
Financial
Price – TiO2
US$/t TiO2 (FOB)
2,500
Empire provided data to Snowden Optiro based on external expert advice
Costs
Mining
US$/t rock
3
Empire provided data
Incremental ore cost
US$/t rock
0.5
Snowden Optiro assumption
Processing
US$/t rock
38
Empire provided assumption
G&A
US$/t rock
1.5
Snowden Optiro assumption
Total ore cost
40
Product transport
US$/t TiO2
20
160 km to Geraldton Port
Royalty
% price
2.5
WA state royalty
Geotech
Saprolite
degrees
40
Snowden Optiro assumption
Weathered/fresh
degrees
45
Snowden Optiro assumption
Marginal cut-off calculation
% TiO2
2.36
Calculation
NB* Calculation derived from Total ore cost / (Process recovery*(Price*(1-Royalty)-Product Transport))*100
See JORC Table 1 Section 2 for more detailed explanation.
Future Drilling to Support MRE Upgrade in 2026
The MRE model is currently being reviewed to ensure future drilling supports an MRE upgrade in mid CY 2026, focused on conversion of some Indicated Resources to Measured at Thomas and Cosgrove deposits. This MRE upgrade would further assist with mine development planning, as well as growth in the overall resource from a substantial Cosgrove MRE grid drilling and Thomas infill drilling programmes, further bulk density work to increase density figure used and ongoing metallurgical test work focused on determining a final process flow sheet and end product specifications.
The Mineral Resource Estimate for Cosgrove is estimated based on the limited drilling completed to date, with no MRE grid drilling completed on a large scale.
The Company has lodged a Programme of Works with the WA government’s Department of Mining, Petroleum and Exploration to support an extensive grid drill out of the Cosgrove Deposit over the next six months. The grid drilling will be designed primarily based on the Thomas MRE grid drilling, being AC drilling on a 400m by 200m lines over a 2km by 5km area and infill RC drilling.
The Company plans to use this planned drilling as a basis to upgrade and expand the Cosgrove MRE.
Further drilling at the Thomas Deposit is being reviewed on the basis of increasing confidence in the weathered zone to support future scoping studies. The Company will base any future drilling at the Thomas Deposit on the ability to increase the confidence of the resource, i.e. targeting a Measured Classification Resource, as well as to increase the size of the resource by additional grid drilling, both internally within the resource (i.e. in areas that have not yet been infill drilled) and also outside the extent of the resource. The focus on Thomas will be the existing high grade core of the resource which sits withing the existing Thomas MRE.
Classification
The MRE has been classified following the guidelines of the Australasian Code for Reporting of Exploration Results, Mineral Resources and Ore Reserves, 2012 (the JORC Code). The MRE has been classified as Inferred and Indicated on the basis of confidence in geological and grade continuity, the quality of the sampling and assay data, and confidence in the estimation of titanium across the deposit. This is based on the robustness of the grade estimate as determined from the drillhole spacing, geological confidence and grade continuity.
Figure 7. Thomas Deposit: MRE Pitshell Outline with Indicated and Inferred Categories.
Figure 8. Cosgrove Deposit: MRE Pitshell Outline with Indicated and Inferred categories.
Mineralogy and Metallurgical Factors or Assumptions
The main titanium minerals at Pitfield are anatase (TiO2) within the saprolite and weathered bedrock and titanite (CaTiSiO5) within the fresh bedrock, rutile (TiO2) is found within all rock types. The minerals have been identified from thin section petrography, SEM and microprobe work. The microprobe work has identified that there are no deleterious elements within the anatase, rutile or titanite.
Metallurgical testwork has been undertaken on a range of samples from the exploration programme. The focus of the testwork has been on the weathered zones, as this is near-surface and extensive. There has been some limited testwork in the underlying fresh bedrock zone and this will continue in subsequent testwork programmes as the flowsheet details start to be confirmed. It is likely that only small modification to the process flowsheet would be required in order to treat the fresh bedrock ore, this assumption will be tested as the project progresses.
Multiple samples from DD core drilling and AC drilling programmes have been selected for metallurgical testwork. Testwork is being managed by Empire’s technical team and being undertaken at a number of commercial laboratories in Perth, Western Australia. The programme has three key areas:
Understanding the mineralogy and physical characteristics of the mineralisation that influence metallurgical performance
Mineral separation process development
Elemental extraction process development
Progress results have been reported previously via RNS, including most recently:
“Significant Progress Achieved on Process Flowsheet” (13/02/25)
Competent Person Statement
The technical information in this report that relates to the Pitfield Project has been compiled by Mr Andrew Faragher, an employee of Empire Metals Australia Pty Ltd, a wholly owned subsidiary of Empire. Mr Faragher is a Member of the Australian Institute of Mining and Metallurgy (AusIMM). Mr Faragher has sufficient experience that is relevant to the style of mineralisation and type of deposit under consideration and to the activity being undertaken to qualify as a Competent Person as defined in the 2012 Edition of the ‘Australasian Code for Reporting of Exploration Results, Mineral Resources and Ore Reserves’. Mr Faragher consents to the inclusion in this release of the matters based on his information in the form and context in which it appears.
The scientific and technical information in this report that relates to process metallurgy is based on information reviewed by Ms Narelle Marriott, an employee of Empire Metals Australia Pty Ltd, a wholly owned subsidiary of Empire. Ms Marriott is a member of the AusIMM and has sufficient experience relevant to the style of mineralisation and type of deposit under consideration and to the activity being undertaken to qualify as a Competent Person as defined in the JORC Code 2012. Ms. Marriott consents to the inclusion in this announcement of the matters based on their information in the form and context in which it appears.
Market Abuse Regulation (MAR) Disclosure
Certain information contained in this announcement would have been deemed inside information for the purposes of Article 7 of Regulation (EU) No 596/2014, as incorporated into UK law by the European Union (Withdrawal) Act 2018, until the release of this announcement.
S. P. Angel Corporate Finance LLP (Nomad & Broker)
Ewan Leggat / Adam Cowl
Tel: 020 3470 0470
Shard Capital Partners LLP (Joint Broker)
Damon Heath / Erik Woolgar
Tel: 020 7186 9950
St Brides Partners Ltd (Financial PR)
Susie Geliher / Charlotte Page
Tel: 020 7236 1177
About Empire Metals Limited
Empire Metals Ltd (AIM:EEE)(OTCQX:EPMLF) is an exploration and resource development company focused on the rapid commercialisation of the Pitfield Titanium Project, located in Western Australia. The titanium discovery at Pitfield is of unprecedented scale, and hosts one of the largest and highest-grade titanium resources reported globally, with a Mineral Resource Estimate (MRE) totalling 2.2 billion tonnes grading 5.1% TiO₂ for 113 million tonnes of contained TiO₂.
The MRE, which covers only the Thomas and Cosgrove deposits, includes a weathered zone resource of 1.26 billion tonnes at 5.2% TiO₂ and a significant Indicated Resource of 697 million tonnes at 5.3% TiO₂, predominantly from the Thomas deposit. Titanium mineralisation at Pitfield occurs from surface and displays exceptional grade continuity along strike and down dip. The MRE extends across just 20% of the known mineralised footprint, providing substantial potential for further resource expansion.
Conventional processing has already produced a high-purity product grading 99.25% TiO₂, suitable for titanium sponge metal or pigment feedstock. The friable, in-situ weathered zone supports low-cost, strip mining without the need for blasting or overburden removal.
With excellent logistics and established infrastructure, including rail links to deep-water ports with direct access to Asia, the USA, Europe and Saudi Arabia, Pitfield is strategically positioned to supply the growing global demand for titanium and other critical minerals.
Empire is now accelerating the economic development of Pitfield, with a vision to produce a high-value titanium metal and/or pigment quality product at Pitfield, to realise the full value potential of this exceptional deposit.
The Company also has two further exploration projects in Australia; the Eclipse Project and the Walton Project in Western Australia, in addition to three precious metals projects located in a historically high-grade gold producing region of Austria.
GLOSSARY OF TERMS AND ABBREVIATIONS
The following definitions are extracted from the JORC Code, 2012 Edition
Indicated Mineral Resource
An ‘Indicated Mineral Resource’ is that part of a Mineral Resource for which quantity, grade (or quality), densities, shape and physical characteristics are estimated with sufficient confidence to allow the application of Modifying Factors in sufficient detail to support mine planning and evaluation of the economic viability of the deposit. Geological evidence is derived from adequately detailed and reliable exploration, sampling and testing gathered through appropriate techniques from locations such as outcrops, trenches, pits, workings and drill holes, and is sufficient to assume geological and grade (or quality) continuity between points of observation where data and samples are gathered. An Indicated Mineral Resource has a lower level of confidence than that applying to a Measured Mineral Resource and may only be converted to a Probable Ore Reserve.
Inferred Mineral Resource
An ‘Inferred Mineral Resource’ is that part of a Mineral Resource for which quantity and grade (or quality) are estimated on the basis of limited geological evidence and sampling. Geological evidence is sufficient to imply but not verify geological and grade (or quality) continuity. It is based on exploration, sampling and testing information gathered through appropriate techniques from locations such as outcrops, trenches, pits, workings and drill holes. An Inferred Mineral Resource has a lower level of confidence than that applying to an Indicated Mineral Resource and must not be converted to an Ore Reserve. It is reasonably expected that the majority of Inferred Mineral Resources could be upgraded to Indicated Mineral Resources with continued exploration.
JORC
JORC stands for Australasian Joint Ore Reserves Committee (JORC). The Code for Reporting of Exploration Results, Mineral Resources and Ore Reserves (the JORC Code) is widely accepted as the definitive standard for the reporting of a company’s resources and reserves. The latest JORC Code is the 2012 Edition.
Measured Mineral Resource
A ‘Measured Mineral Resource’ is that part of a Mineral Resource for which quantity, grade (or quality), densities, shape, and physical characteristics are estimated with confidence sufficient to allow the application of Modifying Factors to support detailed mine planning and final evaluation of the economic viability of the deposit. Geological evidence is derived from detailed and reliable exploration, sampling and testing gathered through appropriate techniques from locations such as outcrops, trenches, pits, workings and drill holes, and is sufficient to confirm geological and grade (or quality) continuity between points of observation where data and samples are gathered. A Measured Mineral Resource has a higher level of confidence than that applying to either an Indicated Mineral Resource or an Inferred Mineral Resource. It may be converted to a Proved Ore Reserve or under certain circumstances to a Probable Ore Reserve
Mineral Reserves or Ore Reserves
An ‘Ore Reserve’ is the economically mineable part of a Measured and/or Indicated Mineral Resource. It includes diluting materials and allowances for losses, which may occur when the material is mined or extracted and is defined by studies at Pre-Feasibility or Feasibility level as appropriate that include application of Modifying Factors. Such studies demonstrate that, at the time of reporting, extraction could reasonably be justified.
Mineral Resource
A ‘Mineral Resource’ is a concentration or occurrence of solid material of economic interest in or on the Earth’s crust in such form, grade (or quality), and quantity that there are reasonable prospects for eventual economic extraction. The location, quantity, grade (or quality), continuity and other geological characteristics of a Mineral Resource are known, estimated or interpreted from specific geological evidence and knowledge, including sampling. Mineral Resources are sub-divided, in order of increasing geological confidence, into Inferred, Indicated and Measured categories.
JORC Code, 2012 Edition – Table 1 report template Section 1 Sampling Techniques and Data
(Criteria in this section apply to all succeeding sections.)
Sampling techniques
Nature and quality of sampling (eg cut channels, random chips, or specific specialised industry standard measurement tools appropriate to the minerals under investigation, such as down hole gamma sondes, or handheld XRF instruments, etc). These examples should not be taken as limiting the broad meaning of sampling.
Include reference to measures taken to ensure sample representivity and the appropriate calibration of any measurement tools or systems used.
Aspects of the determination of mineralisation that are Material to the Public Report.
In cases where ‘industry standard’ work has been done this would be relatively simple (eg ‘reverse circulation drilling was used to obtain 1 m samples from which 3 kg was pulverised to produce a 30 g charge for fire assay’). In other cases more explanation may be required, such as where there is coarse gold that has inherent sampling problems. Unusual commodities or mineralisation types (eg submarine nodules) may warrant disclosure of detailed information.
Air core (AC) samples were collected directly from an AC drill rig using a cone splitter at intervals every 2m downhole.
Reverse circulation (RC) samples were collected directly from an RC drill rig using a cone splitter at intervals every 2m downhole.
Diamond core samples were taken from the diamond core (HQ and NQ) that was sawn in half, with half going for assay and other half retained in core tray. Hole drilled with PQ, predominantly for metallurgical samples, were cut in half and then one half cut in quarter. The quarter was sent for assay and the remaining three quarters retained for metallurgical sampling. Samples were taken based on the geological logging of the drill holes.
Duplicates were inserted with sample numbers ending in 20, 40, 60 and 80 within the numbering sequence and were collected at the same time as the original sample through the chute of the cone splitter. Blanks were inserted at the beginning of each hole and CRM’s were inserted every 25 samples. The Ti grade range of the CRM’s went for <0.5% to <9% Ti to ensure coverage over the range of Ti values that have been seen at Pitfield.
Sample preparation was undertaken at Intertek Minerals laboratory in Maddington WA, where the samples received were sorted and dried. Primary preparation for diamond core samples, crush each sample in its entirety to 3mm. RC samples were primarily crushed to 3mm. Larger volume samples (>5kg) were split with a riffle splitter. All samples were pulverised via robotic pulveriser. Internal screen sizing QAQC is done at 90% passing 75um.
Drilling techniques
Drill type (eg core, reverse circulation, open-hole hammer, rotary air blast, auger, Bangka, sonic, etc) and details (eg core diameter, triple or standard tube, depth of diamond tails, face-sampling bit or other type, whether core is oriented and if so, by what method, etc).
Diamond drilling techniques varied dependent on which phase of drilling, during phase 2 rock rollers were used at the top of hole until competent rock intersected and HQ sized core was drilled (63.5mm diameter) to a depth of approximately 100m and then NQ2 sized core was drilled (50.6mm diameter) to the bottom of the hole.
Drilling in phase 3 and 4 employed PQ size core (83mm diameter) from surface to obtain core for geological, geochemical and metallurgical samples, once PQ core hit competent bedrock HQ size core was drilled to the bottom of the hole.
Where RC drilling techniques were employed holes were drilled from surface using a nominal 140mm face sampling RC drill bit.
AC drilling was carried out from surface with a 76mm air core blue bit
Drill sample recovery
Method of recording and assessing core and chip sample recoveries and results assessed.
Measures taken to maximise sample recovery and ensure representative nature of the samples.
Whether a relationship exists between sample recovery and grade and whether sample bias may have occurred due to preferential loss/gain of fine/coarse material.
Diamond core was reconstructed into continuous runs. Depths were measured from the core barrel and checked against marked depths on the core blocks. Core recoveries are very high with >95% of the drill core having recoveries of >99%
RC sample quality was monitored by the onsite geologist. The sampling methodology from the rig was consistent throughout the drilling program.
AC sample quality was monitored by the onsite geologist. The sampling methodology from the rig was consistent throughout the drilling program.
Overall high drill sample recoveries limit the potential to introduce any sample bias. Duplicate samples are all within tolerance limits and therefore no sample bias has been introduced.
Logging
Whether core and chip samples have been geologically and geotechnically logged to a level of detail to support appropriate Mineral Resource estimation, mining studies and metallurgical studies.
Whether logging is qualitative or quantitative in nature. Core (or costean, channel, etc) photography.
The total length and percentage of the relevant intersections logged.
Detailed diamond drill core logging was carried out, recording weathering, lithology, alteration, mineralisation, structure and mineralogy. Drill core was logged by Empire Metals full time geologists. Drill core logging is qualitative. Drill core was photographed wet and dry in core trays prior to sampling. Core from the entire drill hole was logged.
Detailed RC drill chip logging of every entire drill hole was carried out, recording weathering, lithology, alteration, veining, mineralisation and mineralogy. RC logging on the project has been carried out by Empire Metals full time geologists and contractors. RC logging is qualitative. RC chips were collected in chip trays. Photographs of chip trays were captured.
Detailed AC drill chip logging of every entire drill hole was carried out, recording weathering, lithology, alteration, veining, mineralisation and mineralogy. AC logging on the project has been carried out by Empire Metals full time geologists and contractors. AC logging is qualitative. RC chips were collected in chip trays. Photographs of chip trays were captured.
Rock chips were collected as part of a detailed surface geological mapping program. Qualitative field logging of the rocks was completed in the field including assessment of weathering, lithology, alteration, veining, mineralisation and mineralogy by Empire Metals geologists and consultants.
Sub-sampling techniques and sample preparation
If core, whether cut or sawn and whether quarter, half or all core taken.
If non-core, whether riffled, tube sampled, rotary split, etc and whether sampled wet or dry.
For all sample types, the nature, quality and appropriateness of the sample preparation technique.
Quality control procedures adopted for all sub-sampling stages to maximise representivity of samples.
Measures taken to ensure that the sampling is representative of the in situ material collected, including for instance results for field duplicate/second-half sampling.
Whether sample sizes are appropriate to the grain size of the material being sampled.
Air core (AC) samples were collected directly from an AC drill using a static cone splitter at 2m intervals down hole. Both dry and wet samples were collected. Duplicates were inserted with sample numbers ending in 20, 40, 60 and 80 within the numbering sequence. CRM’s inserted with sample numbers ending in 00, 25, 50 and 75 within the numbering sequence. Blanks inserted at the beginning of the hole.
Reverse circulation (RC) samples were collected directly from an RC drill using a static cone splitter at 2m intervals down hole. Both dry and wet samples were collected. Duplicates were inserted with sample numbers ending in 20, 40, 60 and 80 within the numbering sequence. CRM’s inserted with sample numbers ending in 00, 25, 50 and 75 within the numbering sequence. Blanks inserted at the beginning of the hole.
Diamond core samples were taken from the diamond core (PQ, HQ and NQ) that was sawn in half and then one half cut for assay samples and metallurgical samples. Samples were taken based on the geological logging of the drill holes. Standards inserted with sample numbers ending in 00, 25, 50 and 75 within the numbering sequence.
Sample preparation was undertaken at Intertek Minerals laboratory in Maddington WA, where the samples received were sorted and dried. Primary preparation for diamond core samples, crush each sample in its entirety to 3mm. RC samples were primarily crushed to 3mm. Larger volume samples (>5kg) were split with a riffle splitter. All samples were pulverised via robotic pulveriser. Internal screen sizing QAQC is done at 90% passing 75um.
Duplicate samples are all within tolerance limits and therefore no sample bias has been introduced.
Quality of assay data and laboratory tests
The nature, quality and appropriateness of the assaying and laboratory procedures used and whether the technique is considered partial or total.
For geophysical tools, spectrometers, handheld XRF instruments, etc, the parameters used in determining the analysis including instrument make and model, reading times, calibrations factors applied and their derivation, etc.
Nature of quality control procedures adopted (eg standards, blanks, duplicates, external laboratory checks) and whether acceptable levels of accuracy (ie lack of bias) and precision have been established.
Sample preparation for all AC, RC and diamond samples was undertaken at Intertek Minerals laboratory in Maddington WA, where the samples received were sorted and dried. Primary preparation for diamond core samples was to crush each sample in its entirety to 3mm. AC and RC samples were primarily crushed to 3mm. Larger volume samples (>5kg) were split with a riffle splitter. All samples were pulverised via robotic pulveriser. Internal screen sizing QAQC is done at 90% passing 75um.
Prior to October 2024 a 4 acid digest was used with ICPMS finish (4A/MS48) as the initial assay technique, if the Ti assay values were >2% Ti, the samples were re-assayed using a borate fusion digest to ensure complete digest of Ti minerals, these were then analysed by ICPOES (FP1/OM).
In October 2024 the analytical methodology was altered to reduce the number of initial elements analysed to 33. This was done with a 4-acid digest and samples analysed by ICPOES (4A/OE33). If Ti >2% then the samples were re-assayed using a borate fusion digest used and analysed by ICPOES (FP1/OM).
Certified analytical standards were inserted with sample numbers ending in 00, 25, 50 and 75 within the numbering sequence for all AC, RC and diamond samples.
Duplicates were inserted with sample numbers ending in 20, 40, 60 and 80 sample numbers within the numbering sequence for all AC and RC samples.
Verification of sampling and assaying
The verification of significant intersections by either independent or alternative company personnel.
The use of twinned holes.
Documentation of primary data, data entry procedures, data verification, data storage (physical and electronic) protocols.
Discuss any adjustment to assay data.
Senior technical personnel from the Company (Exploration Manager and Senior Geologist) verified significant intersections.
Logging and sampling were recorded on digital logging and digital sample sheets. Data validation was completed by geologist on the rig. Information was imported into Empire Metals database after data validation by Empire geologists. Geological consultants were also used for data QAQC.
Digital data storage is managed by the company at its offices in Perth.
No adjustments or calibrations have been made to any assay data.
Two twinned holes were drilled at the Thomas prospect, the original RC holes were twinned with AC holes to determine if the AC would provide equivalent sample integrity and similar grade. The analysis done on the results showed that there was no problem with sample size or integrity and the grade over the length of the same size hole was within 0.5% TiO2 i.e. 6.5% TiO2 in original RC hole and 6.1% TiO2 in twinned AC hole.
All QAQC samples, blanks, duplicates and CRM’s display results within acceptable levels of accuracy and precision.
Location of data points
Accuracy and quality of surveys used to locate drill holes (collar and down-hole surveys), trenches, mine workings and other locations used in Mineral Resource estimation.
Specification of the grid system used.
Quality and adequacy of topographic control.
Drill hole collar locations drilled between March 2023 and February 2025 were surveyed by Empire geologists using a handheld Garmin GPS with the expected relative accuracy of 4m for easting, northing and elevation coordinates. Drill hole collars from March 2025 were picked up by a licenced surveyor using a digital GPS to an accuracy of 20mm in easting, northing and elevation coordinates. Collar locations are recorded in the Empire Metals database
The grid system used is GDA94.
Downhole surveys for all angled RC and diamond holes were completed every 10-30m downhole using a Reflex Ez-GyroN tool after the completion of drilling. Downhole azimuth and dip data is recorded in the Empire Metals database.
Rock chip sample locations are determined by handheld GPS with and accuracy of approximately 4m.
Data spacing and distribution
Data spacing for reporting of Exploration Results.
Whether the data spacing and distribution is sufficient to establish the degree of geological and grade continuity appropriate for the Mineral Resource and Ore Reserve estimation procedure(s) and classifications applied.
Whether sample compositing has been applied.
Drillhole spacing is considered sufficient to establish the degree of geological and grade continuity appropriate for a Mineral Resource estimation.
Drillhole spacing is mainly in the range 400m x 200m, closer spaced drilling (100m x 100m) was done to test geological continuity and grade variability whilst also generating samples for bulk metallurgy testwork.
Rock chip sample spacing has been determined solely by geological mapping and no grade continuity is implied.
Sample compositing has been applied to reported exploration results of diamond drillholes as the sample length of individual samples varies and therefore a weighted average has been used to provide the TiO2 intercepts for those holes.
Orientation of data in relation to geological structure
Whether the orientation of sampling achieves unbiased sampling of possible structures and the extent to which this is known, considering the deposit type.
If the relationship between the drilling orientation and the orientation of key mineralised structures is considered to have introduced a sampling bias, this should be assessed and reported if material.
Angled drilling has been in 2 orientated directions, initially at 270° as strike of underlying rocks not certain and then orientated perpendicular to the strike of the beds (240°).
No sampling bias is considered to have been introduced by the existing sampling orientation. The grade continuity of the mineral resource has been demonstrated across every hole that has contained mineralisation.
The orientation of the drilling is not considered to have introduced sampling bias due to the highly homogeneous nature of the deposit.
Sample security
The measures taken to ensure sample security.
Diamond core samples were collected and placed in calico sample bags pre-printed with a unique sample ID at Empire Metals core facility in Three Springs. 5 calico sample bags were placed in a poly weave bags which was cabled tied closed at the top and put in order in the core yard.
RC samples were collected directly from the drill rig in calico sample bags which are pre-printed with a unique sample number. 5 calico sample bags were placed in a poly weave bag and cabled-tied closed at the top. Poly weave bags were transported back to Empire Metals core facility in Three Springs and stored there in order before transport to Perth.
AC samples were collected directly from the drill rig in calico sample bags which are pre-printed with a unique sample number. 5 calico sample bags were placed in a poly weave bag and cabled-tied closed at the top. Poly weave bags were transported back to Empire Metals core facility in Three Springs and stored there in order before transport to Perth.
Rock chip samples were placed in numbered calico bags which were placed in a poly weave bag and cabled tied closed at the top. Poly weave bags were transported back to Empire Metals core facility in Three Springs and stored there in order before transport to Perth.
Poly weave sample bags were transported to Intertek Minerals, Maddington WA. Samples were shipped using Empire vehicles or using transport haulage from Geraldton or Perth for larger sample dispatches.
Refinement of the transportation process meant that the polyweave bags were placed into industrial bulka bags which were individually numbered and the samples contained in the bulka bag recorded on the bag for enhanced chain of custody.
Sample dispatch orders containing the sample numbers, the amount of samples and the method of analysis were generated by Empire geologists and digitally sent to Intertek in Maddington where the samples had been taken.
Audits or reviews
The results of any audits or reviews of sampling techniques and data.
No audits or reviews have been conducted in relation to the current drilling program.
Section 2 Reporting of Exploration Results
(Criteria listed in the preceding section also apply to this section.)
Mineral tenement and land tenure status
Type, reference name/number, location and ownership including agreements or material issues with third parties such as joint ventures, partnerships, overriding royalties, native title interests, historical sites, wilderness or national park and environmental settings.
The security of the tenure held at the time of reporting along with any known impediments to obtaining a licence to operate in the area.
Exploration Licences E70/5465, E70/5876, E70/6320 and E70/6323 are held in a Joint Venture between Empire Metals Australia Pty Ltd (70%) a wholly owned subsidiary of Empire Metals Ltd and Century Minerals Pty Ltd (30%).
There are no overriding royalties on the project.
The project is centred 310km north of Perth and 150km southeast of Geraldton, WA. The tenement area is approximately 1,000km2 in area.
Native flora assessments using the WA Governments Department of Biodiversity, Conservation and Attractions flora database were completed to identify priority flora species that should be avoided when carrying out exploration.
There are 2 nature reserves within the tenement package totalling 37 km2.
The tenements sit within the Yamatji Southern Corporation determined land area. There are only 2 registered sites within the main areas of interest.
The tenements are kept in good standing with all regulatory approvals having been met. There are no known impediments to operate in the area
Exploration done by other parties
Acknowledgment and appraisal of exploration by other parties.
Between the years 1966-1993 Kennecott, Carpentaria (MIM), BHP and CRA explored for sediment hosted copper deposits in the Pitfield Project area.
Kennecott (1966) completed surface geochemistry and drilled 10 diamond holes in the vicinity of Baxter’s which intersected anomalous copper just outside the Pitfield licence.
Carpentaria Exploration (MIM) in early 1980’s, again focussed their exploration work close the Baxter’s mine and adjacent areas towards Arrino, and completed 460 shallow RAB holes over or immediately adjacent to the current Pitfield licence to the SSE of Baxter’s. Carpentaria identified maximum copper values exceeding 1000ppm, with a further 44 holes exceeding 500ppm copper. The work defined a clear 2,500m NNW-SSE copper anomalous trend partly on the Pitfield licence and open to the south and east.
Carpentaria drilled 4 diamond holes which returned strongly anomalous copper including in DH3a, the only hole collared on Pitfield, which returned numerous values exceeding 500ppm up to 1280 ppm Cu with fracture controlled and disseminated native copper and chalcopyrite observed.
BHP (1984) completed shallow RAB and 4 stratigraphic diamond holes successfully testing the western contact of the Yandanooka basin with basement Mullingarra gneiss. BHP failed to intersect any significant metal anomalism. In addition, BHP completed several lines of IP geophysics over the drilled area.
CRA (1993) completed soil sampling, auger sampling building on the work of Carpentaria and 2 diamond holes, the southern hole being located on the Pitfield licence recording moderate copper anomalism with a maximum value of 570ppm (4m composite samples of chipped drill core) associated with fracture-controlled malachite and minor native copper. The auger work defined a significant Cu anomaly (plus Ag) over some 7km strike length.
No other significant exploration happened between 1993 and 2022.
Geology
Deposit type, geological setting and style of mineralisation.
This is a globally unique stratabound sediment hosted titanium deposit. The titanium mineralisation is found within the sediments of the Yandanooka Basin which is located about 350km northeast of Perth. The basin margin in the west is the Mullingarra Complex and in the east the Darling Range, it is interpreted to be Neoproterozoic in age.
The basin fill comprises coarse to fine grained sandstones, conglomerates and interbedded sandstones and siltstones with the basin interpreted to be up to 9km thick. The dominant strike of the beds is 330° with beds dipping 45-65º to the east, field work has not identified any major faulting. However, both airborne magnetics and gravity show strong crustal lineaments in the data.
The titanium mineralisation is associated predominantly with anatase and rutile in the weathered cap and titanite and rutile in the fresh bedrock. The Ti mineralisation is associated with 3 distinct phases whereby a Ti-rich magma was intruded close to surface and eroded into a shallow basin whereby Ti upgrading happened as the sediments were sorted by a natural density-based segregation. A subsequent hydrothermal event related to regional greenschist metamorphism has altered the host sediments and Ti minerals within the sediments and produced an alteration assemblage dominated by titanite (CaTiSiO5), hematite, epidote, carbonate and chlorite. The mineralisation was further upgraded by intense weathering altering the titanite to anatase by removal of the Ca and Si.
The mineralisation is completely stratabound and the best mineralisation is found within the weathered cap whereby the sandstones, siltstone and conglomerates have been altered to saprolite, predominantly quartz and kaolin and the titanite (CaTiSiO5) has altered to anatase (TiO2). The weathered bedrock consists of altered rock, but weathering is less intense, quartz and kaolin are predominant but as the weathering profile turns to fresher material there is an increase in chlorite, epidote, mica, hematite and carbonate. The anatase becomes less and the titanite increases.
Drill hole Information
A summary of all information material to the understanding of the exploration results including a tabulation of the following information for all Material drill holes:
easting and northing of the drill hole collar
elevation or RL (Reduced Level – elevation above sea level in metres) of the drill hole collar
dip and azimuth of the hole
down hole length and interception depth
hole length.
If the exclusion of this information is justified on the basis that the information is not Material and this exclusion does not detract from the understanding of the report, the Competent Person should clearly explain why this is the case.
Hole_ID
Easting
Northing
RL
Total Depth
Dip
Azimuth
Interval
DD23COS001
370715
6738050
320
400.4
-61.94
236.02
173.2m @ 5.76% TiO2 from 18.6m
DD23TOM001
373435
6726485
280
408.5
-60.57
268.41
297.1m @ 6.10% TiO2 from 111.4m
DD24COS002
369845
6738623
303
201.9
-60.12
270.9
201.8m @ 6.32% TiO2 from 0.0m
DD24COS003
369670
6739127
296
201.8
-60.14
270.46
201.8m @ 6.14% TiO2 from 0.0m
DD24TOM002
374175
6727216
299
201.8
-60.21
269.55
201.8m @ 4.95% TiO2 from 0.0m
DD24TOM003
373307
6726036
281
201.8
-60.96
270.55
181.9m @ 6.83% TiO2 from 19.9m
RC23COS002
373243
6737708
303
96
-61.48
271.49
90m @ 4.00% TiO2 from 6.0m
RC23COS003
373811
6737631
301
70
-60
270
60m @ 4.00% TiO2 from 10.0m
RC23COS004
369441
6738618
299
154
-59.52
268.86
154m @ 5.50% TiO2 from 0.0m
RC23COS005
369728
6738815
289
154
-60
270
148m @ 6.18% TiO2 from 6.0m
RC23COS006
370118
6738850
298
154
-60
270
154m @ 5.18% TiO2 from 0.0m
RC23COS007
370383
6738869
301
154
-59.73
268.18
154m @ 5.79% TiO2 from 0.0m
RC23COS008
371179
6737957
332
154
-60.74
269.5
154.0m @ 2.77% TiO2 from 0.0m
RC23COS009
369647
6737881
322
154
-59.59
271.01
154.0m @ 5.01% TiO2 from 0.0m
RC23COS010
369799
6737456
320
154
-60
270
154.0m @ 4.98% TiO2 from 0.0m
RC23COS011
370389
6738005
333
154
-60
270
154.0m @ 4.53% TiO2 from 0.0m
RC23COS012
372065
6738992
326
154
-60
270
126.0m @ 2.42% TiO2 from 28.0m
RC23COS013
371359
6741021
315
148
-60.38
273.64
148.0m @ 2.38% TiO2 from 0.0m
RC23COS014
372200
6741309
314
148
-60.36
273.34
146.0m @ 3.23% TiO2 from 2.0m
RC23KAD004
372207
6728859
311
148
-60.63
270.47
148.0m @ 4.06% TiO2 from 0.0m
RC23KAD005
371765
6728857
323
148
-62.04
268.05
148.0m @ 4.62% TiO2 from 0.0m
RC23KAD006
371390
6728854
318
148
-60
270
134.0m @ 3.34% TiO2 from 14.0m
RC23TOM001
373440
6726500
280
148
-61.32
270.328
138.0m @ 4.67% TiO2 from 10.0m
RC23TOM002
373214
6726484
278
180
-55
270
168.0m @ 6.91% TiO2 from 12.0m
RC23TOM003
373070
6726937
293
180
-55
270
180.0m @ 6.14% TiO2 from 0.0m
RC23TOM004
373836
6726664
281
154
-60
270
154.0m @ 5.38% TiO2 from 0.0m
RC23TOM005
374171
6727169
288
154
-60
270
154.0m @ 5.13% TiO2 from 0.0m
RC23TOM006
374700
6726657
276
154
-60
270
154.0m @ 3.83% TiO2 from 0.0m
RC23TOM007
374310
6726651
276
154
-60
270
154.0m @ 4.99% TiO2 from 0.0m
RC23TOM008
374675
6727103
274
154
-60
270
154.0m @ 3.83% TiO2 from 0.0m
RC23TOM009
374944
6725415
266
142
-60
270
142.0m @ 2.84% TiO2 from 0.0m
RC23TOM010
374715
6725386
271
148
-60
270
148.0m @ 3.84% TiO2 from 0.0m
RC23TOM011
373691
6725855
272
144
-61.26
274.81
138.0m @ 4.41% TiO2 from 6.0m
RC24COS015
369852
6740326
340
148
-72.08
272.89
132.0m @ 5.68% TiO2 from 16.0m
RC24COS016
370095
6739746
333
148
-71.32
270.64
136.0m @ 6.08% TiO2 from 12.0m
RC24COS017
369812
6739643
322
148
-69.03
269.01
148.0m @ 5.55% TiO2 from 0.0m
RC24COS018
369445
6739556
317
148
-69.69
273.41
148.0m @ 6.30% TiO2 from 0.0m
RC24COS019
369895
6738264
316
148
-69.35
269.51
148.0m @ 6.49% TiO2 from 0.0m
RC24COS020
370258
6738318
312
148
-70.26
270.78
148.0m @ 5.16% TiO2 from 0.0m
RC24COS021
370629
6738361
285
148
-71
271.42
148.0m @ 5.81% TiO2 from 0.0m
RC24COS022
370507
6737510
331
148
-70.92
272.52
148.0m @ 4.08% TiO2 from 0.0m
RC24COS023
371037
6737505
339
148
-70.73
272.04
148.0m @ 4.94% TiO2 from 0.0m
RC24COS024
370347
6736595
324
148
-70.18
268.86
148.0m @ 4.77% TiO2 from 0.0m
RC24COS025
371401
6736574
312
148
-70.31
273.11
148.0m @ 4.92% TiO2 from 0.0m
RC24COS026
370776
6735770
328
150
-70.33
268.54
150.0m @ 3.88% TiO2 from 0.0m
RC24COS027
371546
6735757
309
150
-70.87
269.49
150.0m @ 6.02% TiO2 from 0.0m
RC24COS028
371923
6735766
315
154
-70.63
269.22
154.0m @ 2.44% TiO2 from 0.0m
RC24COS029
373222
6733611
284
154
-70.13
271.5
154.0m @ 3.83% TiO2 from 0.0m
RC24COS030
372291
6733611
306
154
-70.08
273.81
154.0m @ 6.05% TiO2 from 0.0m
RC24COS031
371255
6734645
348
154
-71.37
272.12
154.0m @ 3.11% TiO2 from 0.0m
RC24COS032
371875
6734617
318
154
-71.13
269.95
154.0m @ 6.31% TiO2 from 0.0m
RC24COS033
373358
6735814
300
154
-70.27
268.97
154.0m @ 3.28% TiO2 from 0.0m
RC24COS034
372780
6734632
320
154
-69.31
270.47
154.0m @ 4.43% TiO2 from 0.0m
RC24TOM012
375491
6720393
300
154
-70.31
271.6
154.0m @ 3.12% TiO2 from 0.0m
RC24TOM013
374903
6720384
291
154
-70.68
268.91
154.0m @ 4.51% TiO2 from 0.0m
RC24TOM014
375019
6721403
277
154
-71.88
272.04
142.0m @ 4.01% TiO2 from 12.0m
RC24TOM015
374195
6722453
288
154
-71.69
270.58
154.0m @ 5.30% TiO2 from 0.0m
RC24TOM016
374818
6722464
292
154
-71.49
270.64
154.0m @ 4.78% TiO2 from 0.0m
RC24TOM017
374538
6723753
277
154
-70.07
270.68
134.0m @ 4.76% TiO2 from 20.0m
RC24TOM018
374090
6723708
286
154
-70.67
268.43
154.0m @ 5.13% TiO2 from 0.0m
RC24TOM019
374239
6724317
296
154
-70.81
268.42
154.0m @ 5.29% TiO2 from 0.0m
RC24TOM020
373649
6723472
285
154
-67.81
266.94
154.0m @ 4.89% TiO2 from 0.0m
RC24TOM021
373699
6724326
308
154
-70.22
270.47
154.0m @ 6.44% TiO2 from 0.0m
RC24TOM022
373329
6724796
308
154
-70.8
270.9
154.0m @ 6.76% TiO2 from 0.0m
RC24TOM023
373639
6724978
301
154
-70.05
272.26
154.0m @ 5.83% TiO2 from 0.0m
RC24TOM024
373512
6725562
289
154
-69.57
268.64
154.0m @ 5.82% TiO2 from 0.0m
RC24TOM025
374129
6725497
289
154
-79.91
271.8
154.0m @ 5.96% TiO2 from 0.0m
RC24TOM026
374179
6725039
292
154
-70.4
278.7
154.0m @ 5.39% TiO2 from 0.0m
RC24TOM027
373785
6727186
293
154
-70.32
269.71
154.0m @ 5.91% TiO2 from 0.0m
RC24TOM028
373851
6726206
269
154
-71.54
271.42
154.0m @ 5.77% TiO2 from 0.0m
RC24TOM029
373063
6727257
315
154
-69.9
272.66
152.0m @ 5.61% TiO2 from 2.0m
RC24TOM030
372871
6727570
314
154
-69.99
88.11
154.0m @ 5.12% TiO2 from 0.0m
DD24COS004
369997
6737088
328
78.7
-60.66
240.71
78.7m @ 5.55% TiO2 from 0.0m
DD24COS005
370830
6738034
329
48.7
-59.47
242.64
48.7m @ 5.99% TiO2 from 0.0m
DD24COS006
369820
6738289.1
306
48.4
-59.96
240.95
48.4m @ 6.14% TiO2 from 0.0m
DD24COS007
369939
6739725
306
62.7
-60.18
236.89
Whole core to met test
DD24COS008
369602
6739755
302
72.7
-61.5
231.12
Whole core to met test
DD24TOM004
373566
6724538
309
75.4
-60.73
236.19
Whole core to met test
DD24TOM005
373469
6724805
314
81.4
-60.34
237.66
Whole core to met test
DD24TOM006
373947
6724741
303
72.6
-60.05
240.02
72.6m @ 5.48% TiO2 from 0.0m
DD24TOM007
374150
6724504
302
65.8
-60.89
243.54
54.3m @ 5.66% TiO2 from 0.0m
DD24TOM008
373245
6726696
289
72.6
-60.79
240.96
72.6m @ 5.70% TiO2 from 0.0m
AC25COS001
369985
6737084.2
323
68
-60
240
60m @ 6.30% TiO2 from 0m
AC25COS002
369796
6737462
317
48
-60
270
48m @ 6.02% TiO2 from 0m
AC25COS003
369631
6737453.2
310
36
-90
0
32m @ 4.83% TiO2 from 4m
AC25COS004
369912
6737556
319
44
-90
0
24m @ 5.41% TiO2 from 0m
AC25COS005
370062
6737577.1
322
40
-90
0
34m @ 6.12% TiO2 from 6m
AC25COS006
370139
6737530.4
322
51
-90
0
50m @ 6.25% TiO2 from 0m
AC25COS007
370043
6737496.2
324
48
-90
0
32m @ 6.35% TiO2 from 0m
AC25COS008
369945
6737463.6
323
46
-90
0
40m @ 4.11% TiO2 from 0m
AC25COS009
369863
6737419.3
320
48
-90
0
48m @ 5.04% TiO2 from 0m
AC25COS010
369760
6737393.5
319
45
-90
0
38m @ 4.20% TiO2 from 0m
AC25COS011
369664
6737353.2
316
44
-90
0
44m @ 3.76% TiO2 from 0m
AC25COS012
369703
6737267.2
320
40
-90
0
34m @ 4.15% TiO2 from 0m
AC25COS013
369792
6737303.5
323
53
-90
0
53m @ 3.48% TiO2 from 0m
AC25COS014
369889
6737333.9
325
50
-90
0
50m @ 5.00% TiO2 from 0m
AC25COS015
369983
6737369.4
326
52
-90
0
52m @ 5.23% TiO2 from 0m
AC25COS016
370076
6737403.3
324
50
-90
0
50m @ 6.54% TiO2 from 0m
AC25COS017
370169
6737435.8
325
52
-90
0
52m @ 6.40% TiO2 from 0m
AC25COS018
370201
6737338.5
327
56
-90
0
56m @ 5.08% TiO2 from 0m
AC25COS019
370104
6737305.4
326
56
-90
0
56m @ 5.67% TiO2 from 0m
AC25COS020
370012
6737272.2
328
50
-90
0
50m @ 4.23% TiO2 from 0m
AC25COS021
369917
6737239.9
323
55
-90
0
55m @ 5.77% TiO2 from 0m
AC25COS022
369823
6737211.2
321
48
-90
0
48m @ 3.99% TiO2 from 0m
AC25COS023
369730
6737176.5
318
46
-90
0
36m @ 4.49% TiO2 from 0m
AC25COS024
369726
6737110.2
314
40
-90
0
40m @ 3.87% TiO2 from 0m
AC25COS025
369860
6737113.3
317
42
-90
0
42m @ 4.33% TiO2 from 0m
AC25COS026
369953
6737145.9
323
58
-90
0
58m @ 6.22% TiO2 from 0m
AC25COS027
370045
6737183.4
326
54
-90
0
54m @ 4.81% TiO2 from 0m
AC25COS028
370144
6737214.4
327
56
-90
0
56m @ 6.55% TiO2 from 0m
AC25COS029
370238
6737247
327
56
-90
0
56m @ 6.51% TiO2 from 0m
AC25COS030
370270
6737155.1
326
60
-90
0
60m @ 5.61% TiO2 from 0m
AC25COS031
370175
6737121
325
52
-90
0
52m @ 6.55% TiO2 from 0m
AC25COS032
370079
6737086.5
324
56
-90
0
56m @ 4.68% TiO2 from 0m
AC25COS033
369987
6737054
322
58
-90
0
58m @ 5.02% TiO2 from 0m
AC25COS034
369891
6737020.3
317
51
-90
0
51m @ 3.94% TiO2 from 0m
AC25COS035
369933
6736919.6
318
46
-90
0
46m @ 3.73% TiO2 from 0m
AC25COS036
370019
6736958.6
320
46
-90
0
46m @ 6.81% TiO2 from 0m
AC25COS037
370114
6736993.2
323
54
-90
0
54m @ 5.23% TiO2 from 0m
AC25COS038
370207
6737024.8
324
52
-90
0
52m @ 6.74% TiO2 from 0m
AC25COS039
370282
6737058
325
48
-90
0
50m @ 6.24% TiO2 from 0m
AC25COS040
370053
6736867.7
321
48
-90
0
48m @ 5.03% TiO2 from 0m
AC25COS041
370148
6736895.9
323
52
-90
0
52m @ 5.43% TiO2 from 0m
AC25COS042
370242
6736931.5
325
56
-90
0
56m @ 7.15% TiO2 from 0m
AC25TOM001
373330
6724794.2
305
59
-70
270
59m @ 6.17% TiO2 from 0m
AC25TOM002
373699
6724327
298
66
-70
270
62m @ 6.39% TiO2 from 4m
AC25TOM003
373743
6724164.6
295
56
-90
0
56m @ 6.16% TiO2 from 0m
AC25TOM004
373716
6724260.4
297
52
-90
0
48m @ 5.90% TiO2 from 4m
AC25TOM005
373679
6724350.4
299
58
-90
0
54m @ 5.80% TiO2 from 4m
AC25TOM006
373650
6724136.4
295
60
-90
0
59m @ 6.36% TiO2 from 1m
AC25TOM007
373620
6724230.4
297
58
-90
0
58m @ 5.88% TiO2 from 0m
AC25TOM008
373592
6724327.3
299
62
-90
0
60m @ 6.20% TiO2 from 2m
AC25TOM009
373563
6724420.9
300
54
-90
0
52m @ 5.92% TiO2 from 2m
AC25TOM010
373551
6724106.3
296
45
-90
0
43m @ 6.59% TiO2 from 2m
AC25TOM011
373543
6724199.5
297
54
-90
0
52m @ 6.44% TiO2 from 2m
AC25TOM012
373329
6724786.9
305
56
-70
270
56m @ 5.73% TiO2 from 0m
AC25TOM013
373188
6724966.9
303
60
-90
0
58m @ 5.51% TiO2 from 2m
AC25TOM014
373226
6724838.7
305
58
-90
0
56m @ 6.16% TiO2 from 2m
AC25TOM015
373428
6724168.4
299
52
-90
0
52m @ 5.79% TiO2 from 0m
AC25TOM016
373398
6724267.2
300
52
-90
0
50m @ 6.34% TiO2 from 2m
AC25TOM017
373369
6724362.9
302
50
-90
0
48m @ 6.30% TiO2 from 2m
AC25TOM018
373338
6724458.6
302
52
-90
0
50m @ 6.66% TiO2 from 2m
AC25TOM019
373307
6724549
303
52
-90
0
48m @ 6.11% TiO2 from 4m
AC25TOM020
373281
6724648.7
306
48
-90
0
48m @ 5.74% TiO2 from 0m
AC25TOM021
373250
6724746.7
305
49
-90
0
49m @ 7.49% TiO2 from 0m
AC25TOM022
373484
6724295.9
299
54
-90
0
54m @ 6.50% TiO2 from 0m
AC25TOM023
373457
6724393.4
301
50
-90
0
46m @ 5.66% TiO2 from 4m
AC25TOM024
373432
6724487.3
302
56
-90
0
54m @ 5.70% TiO2 from 2m
AC25TOM025
373406
6724582.6
304
52
-90
0
50m @ 6.08% TiO2 from 2m
AC25TOM026
373381
6724679.7
306
50
-90
0
50m @ 6.11% TiO2 from 0m
AC25TOM027
373351
6724773.2
305
51
-90
0
49m @ 6.06% TiO2 from 2m
AC25TOM028
373324
6724868.3
303
60
-90
0
60m @ 6.09% TiO2 from 0m
AC25TOM029
373289
6724981.4
302
56
-90
0
54m @ 5.24% TiO2 from 2m
AC25TOM030
373472
6724708.7
307
48
-90
0
48m @ 6.02% TiO2 from 0m
AC25TOM031
373446
6724803
305
54
-90
0
54m @ 6.70% TiO2 from 0m
AC25TOM032
373413
6724899.1
302
60
-90
0
58m @ 5.74% TiO2 from 2m
AC25TOM033
373394
6724986
301
57
-90
0
55m @ 6.29% TiO2 from 2m
AC25TOM034
373262
6725066.1
300
47
-90
0
47m @ 4.41% TiO2 from 0m
AC25TOM035
373161
6725044.8
302
50
-90
0
48m @ 5.29% TiO2 from 2m
AC25TOM036
373359
6725089.9
299
54
-90
0
52m @ 7.21% TiO2 from 2m
AC25TOM037
373479
6725024.5
299
52
-90
0
50m @ 6.72% TiO2 from 2m
AC25TOM038
373532
6724521.5
303
50
-90
0
50m @ 6.69% TiO2 from 0m
AC25TOM039
373506
6724612.9
305
51
-90
0
51m @ 7.55% TiO2 from 0m
AC25TOM040
373599
6724639.4
305
57
-90
0
57m @ 7.48% TiO2 from 0m
AC25TOM041
373572
6724737.1
306
54
-90
0
54m @ 7.19% TiO2 from 0m
AC25TOM042
373547
6724823.5
305
52
-90
0
52m @ 7.43% TiO2 from 0m
AC25TOM043
373554
6724948.1
301
58
-90
0
58m @ 6.08% TiO2 from 0m
AC25TOM044
374399
6727318.7
280
48
-90
0
48m @ 3.96% TiO2 from 0m
AC25TOM045
374200
6727299.9
284
48
-90
0
48m @ 4.69% TiO2 from 0m
AC25TOM046
374000
6727298.6
286
52
-90
0
48m @ 4.95% TiO2 from 4m
AC25TOM047
373801
6727298.6
293
47
-90
0
47m @ 5.72% TiO2 from 4m
AC25TOM048
373600
6727298.7
298
51
-90
0
47m @ 5.91% TiO2 from 4m
AC25TOM049
373399
6727331.6
302
42
-90
0
38m @ 2.72% TiO2 from 4m
AC25TOM050
373200
6727298.5
304
52
-90
0
46m @ 4.03% TiO2 from 6m
AC25TOM051
373039
6727298.6
304
48
-90
0
48m @ 5.23% TiO2 from 0m
AC25TOM052
372984
6726900.1
295
42
-90
0
42m @ 6.67% TiO2 from 0m
AC25TOM053
373228
6726902.1
290
45
-90
0
45m @ 3.91% TiO2 from 0m
AC25TOM054
373401
6726901.6
291
43
-90
0
43m @ 3.82% TiO2 from 0m
AC25TOM055
372601
6724901.3
317
52
-90
0
52m @ 3.19% TiO2 from 0m
AC25TOM056
372801
6724901.6
311
54
-90
0
52m @ 4.08% TiO2 from 2m
AC25TOM057
373000
6724912.6
307
62
-90
0
60m @ 6.22% TiO2 from 2m
AC25TOM058
373201
6724502.2
304
54
-90
0
46m @ 4.49% TiO2 from 8m
AC25TOM059
372999
6724498.4
308
54
-90
0
50m @ 4.49% TiO2 from 4m
AC25TOM060
372800
6724498.6
313
30
-90
0
30m @ 4.49% TiO2 from 0m
AC25TOM061
372601
6724500.3
323
35
-90
0
35m @ 0.93% TiO2 from 0m
AC25TOM062
373600
6724901.1
302
54
-90
0
54m @ 6.00% TiO2 from 0m
AC25TOM063
373802
6724905.6
299
52
-90
0
52m @ 5.59% TiO2 from 0m
AC25TOM064
374000
6724898.3
295
44
-90
0
40m @ 5.59% TiO2 from 4m
AC25TOM065
374156
6724902.7
293
38
-90
0
38m @ 5.59% TiO2 from 0m
AC25TOM066
373999
6724498.8
295
61
-90
0
61m @ 6.47% TiO2 from 0m
AC25TOM067
373301
6724156.7
302
50
-90
0
50m @ 5.15% TiO2 from 0m
AC25TOM068
372701
6724101
308
29
-90
0
28m @ 1.08% TiO2 from 0m
AC25TOM069
372901
6724101.4
305
29
-90
0
29m @ 0.81% TiO2 from 0m
AC25TOM070
372790
6723699.3
292
18
-90
0
18m @ 1.12% TiO2 from 0m
AC25TOM071
373000
6723701.3
290
57
-90
0
57m @ 1.91% TiO2 from 0m
AC25TOM072
373199
6723701.2
287
57
-90
0
47m @ 4.53% TiO2 from 10m
AC25TOM073
373398
6723700.3
287
53
-90
0
45m @ 4.53% TiO2 from 8m
AC25TOM074
373601
6723701.7
291
51
-90
0
51m @ 5.05% TiO2 from 0m
AC25TOM075
373801
6723701.6
286
48
-90
0
48m @ 5.82% TiO2 from 0m
AC25TOM076
373984
6723701.5
279
60
-90
0
60m @ 5.26% TiO2 from 0m
AC25TOM077
374200
6723701.7
273
60
-90
0
54m @ 5.84% TiO2 from 6m
AC25TOM078
374298
6724100.1
282
48
-90
0
44m @ 5.18% TiO2 from 4m
AC25TOM079
374189
6724094.3
283
51
-90
0
51m @ 5.13% TiO2 from 0m
AC25TOM080
373859
6724096
292
57
-90
0
53m @ 6.49% TiO2 from 4m
AC25TOM081
373700
6724097.8
294
60
-90
0
58m @ 6.55% TiO2 from 2m
AC25TOM082
374401
6723735
270
50
-90
0
40m @ 4.11% TiO2 from 10m
AC25TOM083
374599
6723720.5
269
50
-90
0
50m @ 3.64% TiO2 from 0m
AC25TOM084
374804
6723730.4
268
50
-90
0
44m @ 4.31% TiO2 from 6m
AC25TOM085
374701
6724098.6
277
47
-90
0
43m @ 4.31% TiO2 from 4m
AC25TOM086
374500
6724098.2
278
60
-90
0
54m @ 5.52% TiO2 from 6m
AC25TOM087
374599
6724498.3
285
44
-90
0
34m @ 4.86% TiO2 from 10m
AC25TOM088
374433
6724855.9
289
43
-90
0
27m @ 4.12% TiO2 from 16m
AC25TOM089
374600
6724901.3
286
38
-90
0
22m @ 4.25% TiO2 from 16m
AC25TOM090
374399
6724499.7
286
42
-90
0
42m @ 5.42% TiO2 from 0m
AC25TOM091
374901
6722898.7
271
60
-90
0
58m @ 3.90% TiO2 from 2m
AC25TOM092
374802
6722500.5
283
69
-90
0
69m @ 4.47% TiO2 from 0m
AC25TOM093
375000
6722501.7
277
48
-90
0
48m @ 3.65% TiO2 from 0m
AC25TOM094
374801
6722149.8
287
42
-90
0
42m @ 4.49% TiO2 from 0m
AC25TOM095
375001
6722098.7
287
46
-90
0
46m @ 4.06% TiO2 from 0m
AC25TOM096
374500
6722898.5
277
54
-90
0
54m @ 4.70% TiO2 from 0m
AC25TOM097
374299
6722898.5
272
55
-90
0
51m @ 4.80% TiO2 from 4m
AC25TOM098
374131
6722843.6
272
45
-90
0
41m @ 4.27% TiO2 from 4m
AC25TOM099
374402
6722500
286
58
-90
0
58m @ 5.08% TiO2 from 0m
AC25TOM100
374600
6722501.8
287
68
-90
0
68m @ 4.57% TiO2 from 0m
AC25TOM101
374201
6722498.8
282
48
-90
0
48m @ 4.54% TiO2 from 0m
AC25TOM102
374402
6722100.5
295
66
-90
0
66m @ 4.47% TiO2 from 0m
AC25TOM103
374565
6722100.8
296
64
-90
0
64m @ 4.68% TiO2 from 0m
AC25TOM104
374200
6722098.1
293
54
-90
0
54m @ 5.39% TiO2 from 0m
AC25TOM105
374000
6722098.3
291
62
-90
0
58m @ 5.39% TiO2 from 4m
AC25TOM106
373799
6722098.5
291
62
-90
0
60m @ 3.45% TiO2 from 4m
AC25TOM107
373600
6722098.1
293
63
-90
0
63m @ 2.25% TiO2 from 0m
AC25TOM108
373411
6722503.3
281
35
-90
0
35m @ 1.17% TiO2 from 0m
AC25TOM109
373600
6722501.5
281
50
-90
0
46m @ 3.30% TiO2 from 4m
AC25TOM110
373799
6722503.3
283
57
-90
0
55m @ 3.13% TiO2 from 2m
AC25TOM111
374000
6722504
282
58
-90
0
58m @ 4.85% TiO2 from 0m
AC25TOM112
373199
6722098.7
291
29
-90
0
29m @ 0.53% TiO2 from 0m
AC25TOM113
373000
6722102.3
291
54
-90
0
54m @ 3.02% TiO2 from 0m
AC25TOM114
373001
6722498.8
284
29
-90
0
29m @ 2.90% TiO2 from 0m
AC25TOM115
373448
6722901.4
280
42
-90
0
42m @ 3.72% TiO2 from 0m
AC25TOM116
373299
6722896.8
286
52
-90
0
52m @ 2.09% TiO2 from 0m
AC25TOM117
373099
6722898.1
293
18
-90
0
18m @ 1.21% TiO2 from 0m
AC25TOM118
373199
6725301.5
298
54
-90
0
54m @ 7.41% TiO2 from 0m
AC25TOM119
373300
6725701.9
283
51
-90
0
45m @ 5.68% TiO2 from 6m
AC25TOM120
373502
6725699.1
280
48
-90
0
44m @ 5.40% TiO2 from 4m
AC25TOM121
373701
6725701.9
276
37
-90
0
33m @ 4.71% TiO2 from 4m
AC25TOM122
373901
6725701.7
274
42
-90
0
38m @ 5.39% TiO2 from 4m
AC25TOM123
374101
6725701.9
271
48
-90
0
44m @ 6.01% TiO2 from 4m
AC25TOM124
374301
6725701.7
269
48
-90
0
44m @ 5.44% TiO2 from 4m
AC25TOM125
374502
6725700.8
267
47
-90
0
43m @ 2.97% TiO2 from 4m
AC25TOM126
374425
6725299.4
279
33
-90
0
33m @ 4.93% TiO2 from 0m
AC25TOM127
374201
6725298.1
282
38
-90
0
38m @ 5.66% TiO2 from 0m
AC25TOM128
373990
6725298.1
291
44
-90
0
44m @ 5.78% TiO2 from 0m
AC25TOM129
373801
6725298.4
285
58
-90
0
56m @ 6.23% TiO2 from 2m
AC25TOM130
373099
6725698.7
287
54
-90
0
50m @ 7.84% TiO2 from 4m
AC25TOM131
372499
6726099.8
290
36
-90
0
34m @ 2.76% TiO2 from 2m
AC25TOM132
372700
6726117.7
286
48
-90
0
44m @ 5.19% TiO2 from 4m
AC25TOM133
372898
6726156.1
281
45
-90
0
37m @ 6.03% TiO2 from 8m
AC25TOM134
372504
6726409.7
279
33
-90
0
23m @ 6.03% TiO2 from 10m
AC25TOM135
373600
6726922.4
288
50
-90
0
50m @ 5.49% TiO2 from 0m
AC25TOM136
373097
6726498.9
277
45
-90
0
41m @ 6.92% TiO2 from 4m
AC25TOM137
373295
6726503.5
278
49
-90
0
47m @ 4.54% TiO2 from 2m
AC25TOM138
373501
6726501.3
277
44
-90
0
44m @ 4.42% TiO2 from 0m
AC25TOM139
373700
6726501.2
278
46
-90
0
46m @ 5.45% TiO2 from 0m
AC25TOM140
373870
6726175.7
266
51
-90
0
51m @ 5.34% TiO2 from 0m
AC25TOM141
373695
6726171.6
268
49
-90
0
41m @ 5.86% TiO2 from 8m
AC25TOM142
373898
6726503.2
277
47
-90
0
47m @ 6.11% TiO2 from 0m
AC25TOM143
374100
6726501.6
277
40
-90
0
40m @ 4.94% TiO2 from 0m
AC25TOM144
374299
6726563.5
275
36
-90
0
36m @ 4.19% TiO2 from 0m
AC25TOM145
374502
6726500.7
269
33
-90
0
33m @ 4.46% TiO2 from 0m
AC25TOM146
374700
6726499.7
267
30
-90
0
30m @ 3.51% TiO2 from 0m
AC25TOM147
374169
6726898.9
280
32
-90
0
32m @ 4.69% TiO2 from 0m
AC25TOM148
373974
6726886.8
288
38
-90
0
38m @ 5.60% TiO2 from 0m
AC25TOM149
373800
6726898.6
287
30
-90
0
30m @ 6.17% TiO2 from 0m
AC25TOM150
374296
6726183.4
266
38
-90
0
36m @ 4.44% TiO2 from 2m
AC25TOM151
374536
6726191.8
266
42
-90
0
42m @ 4.71% TiO2 from 0m
AC25TOM152
374700
6726202.2
263
34
-90
0
28m @ 3.39% TiO2 from 6m
AC25TOM153
374901
6726203.6
264
54
-90
0
48m @ 3.33% TiO2 from 6m
AC25TOM154
374621
6727318.1
271
54
-90
0
54m @ 3.51% TiO2 from 0m
AC25TOM155
374797
6727319.9
266
48
-90
0
46m @ 3.28% TiO2 from 0m
AC25TOM156
373103
6726170.2
277
48
-90
0
22m @ 3.40% TiO2 from 14m
AC25TOM157
373297
6726171.5
273
36
-90
0
38m @ 3.96% TiO2 from 8m
AC25TOM158
373501
6726169.7
270
46
-90
0
34m @ 4.17% TiO2 from 12m
AC25TOM159
372799
6726902.2
290
44
-90
0
44m @ 7.87% TiO2 from 0m
AC25TOM160
372600
6726898.5
287
36
-90
0
36m @ 4.33% TiO2 from 0m
AC25TOM161
372399
6726898.5
289
44
-90
0
44m @ 4.80% TiO2 from 0m
AC25TOM162
372188
6726897.3
289
19
-90
0
15m @ 4.04% TiO2 from 4m
AC25TOM163
371997
6726895.4
290
20
-90
0
20m @ 1.45% TiO2 from 0m
AC25TOM164
372799
6727298.9
298
36
-90
0
36m @ 6.50% TiO2 from 0m
AC25TOM165
372562
6727300.7
300
37
-90
0
35m @ 3.95% TiO2 from 2m
AC25TOM166
372398
6727298.2
302
46
-90
0
46m @ 4.24% TiO2 from 0m
AC25TOM167
372197
6727315.7
302
37
-90
0
33m @ 5.39% TiO2 from 4m
AC25TOM168
371997
6727316.8
304
21
-90
0
15m @ 4.71% TiO2 from 6m
AC25TOM169
372898
6726498.6
276
41
-90
0
33m @ 7.28% TiO2 from 8m
AC25TOM170
372698
6726498.5
278
32
-90
0
28m @ 3.76% TiO2 from 4m
AC25TOM171
372300
6726098.1
296
32
-90
0
10m @ 4.91% TiO2 from 16m
AC25TOM172
372296
6726497.3
281
15
-90
0
15m @ 0.72% TiO2 from 0m
AC25TOM173
375000
6724899.8
280
44
-90
0
42m @ 2.63% TiO2 from 2m
AC25TOM174
374803
6724896.5
282
41
-90
0
35m @ 2.87% TiO2 from 6m
AC25TOM175
374999
6725297.8
267
47
-90
0
43m @ 3.08% TiO2 from 4m
AC25TOM176
374771
6725296.4
273
44
-90
0
44m @ 3.23% TiO2 from 0m
AC25TOM177
374698
6725700.5
263
41
-90
0
37m @ 3.73% TiO2 from 4m
AC25TOM178
374897
6725694
262
45
-90
0
45m @ 2.79% TiO2 from 0m
AC25TOM179
374801
6724503.6
283
34
-90
0
34m @ 3.56% TiO2 from 0m
AC25TOM180
374999
6724502
283
36
-90
0
33m @ 3.02% TiO2 from 4m
AC25TOM181
375066
6724184.5
282
44
-90
0
44m @ 3.14% TiO2 from 0m
AC25TOM182
374902
6724154.6
280
27
-90
0
28m @ 4.07% TiO2 from 0m
AC25TOM183
373790
6724606
304
57
-90
0
57m @ 6.04% TiO2 from 0m
RC25TOM031
374129
6726684.7
280
100
-70.5
229.9
100m @ 5.44% TiO2 from 0m
RC25TOM032
374112
6724694.7
296
100
-70.4
229.3
100m @ 5.07% TiO2 from 0m
RC25TOM033
373592
6724700.8
306
100
-69.9
228.9
100m @ 6.51% TiO2 from 0m
RC25TOM034
373045
6724697.3
306
100
-70.7
230.3
98m @ 4.52% TiO2 from 2m
RC25TOM035
372715
6724701.7
315
100
-70.3
225.8
100m @ 0.98% TiO2 from 0m
RC25TOM036
373144
6724300.7
306
100
-70.9
233.6
96m @ 4.12% TiO2 from 4m
RC25TOM037
372714
6724299.8
315
100
-71.2
229.1
94m @ 1.05% TiO2 from 6m
RC25TOM038
372813
6723899.2
299
100
-71.1
235.2
100m @ 1.31% TiO2 from 0m
RC25TOM039
373109
6723901.5
294
100
-70.3
230.4
48m @ 2.37% TiO2 from 0m
RC25TOM041
372949
6723501.2
286
100
-70.6
232.8
94m @ 0.74% TiO2 from 6m
RC25TOM042
373299
6723501.1
280
100
-70.5
235.4
92m @ 2.59% TiO2 from 8m
RC25TOM043
374094
6723532.2
270
100
-70.4
230.8
94m @ 4.56% TiO2 from 6m
RC25TOM044
373827
6723950.2
289
100
-70.5
237.5
98m @ 5.51% TiO2 from 2m
RC25TOM045
374417
6723934.9
275
100
-70.8
228.6
94m @ 4.48% TiO2 from 6m
RC25TOM046
374848
6722701.3
276
100
-70.4
230.8
100m @ 4.13% TiO2 from 0m
RC25TOM047
374189
6722701
277
100
-71
230.2
98m @ 4.66% TiO2 from 2m
RC25TOM048
374494
6722309
291
100
-70.3
232.2
100m @ 5.13% TiO2 from 0m
RC25TOM049
374102
6722297.6
286
100
-70.7
228.6
100m @ 4.64% TiO2 from 0m
RC25TOM050
373705
6722302
289
100
-71.1
230
100m @ 2.79% TiO2 from 0m
RC25TOM051
373210
6722302.4
285
34
-70.6
227.4
34m @ 0.62% TiO2 from 0m
RC25TOM052
373301
6722710.4
280
34
-70.6
232.7
34m @ 0.75% TiO2 from 0m
RC25TOM053
374576
6724700.9
287
100
-71.3
229.1
82m @ 4.09% TiO2 from 18m
RC25TOM054
374190
6726329.1
278
100
-70.5
231.4
100m @ 5.85% TiO2 from 0m
RC25TOM055
373624
6726300.9
270
100
-70.5
229.1
100m @ 4.72% TiO2 from 0m
RC25TOM056
373415
6727102.6
294
100
-71
234.8
100m @ 3.34% TiO2 from 0m
RC25TOM057
373193
6726300.8
275
100
-71.3
231.9
86m @ 6.10% TiO2 from 14m
RC25TOM058
372777
6726301
279
100
-70.9
237.6
90m @ 4.09% TiO2 from 10m
RC25TOM059
372672
6726703.8
282
38
-71.5
229.9
36m @ 3.93% TiO2 from 2m
RC25TOM060
372693
6727101.2
292
70
-70.8
231.4
70m @ 4.60% TiO2 from 0m
RC25TOM061
372775
6725511.4
297
100
-71.3
214.4
96m @ 3.51% TiO2 from 4m
RC25TOM062
373070
6725900.4
282
100
-71.1
223.1
98m @ 7.05% TiO2 from 2m
RC25TOM063
373483
6724551.4
304
100
-70
230
100m @ 6.87% TiO2 from 0m
RC25TOM064
373840
6725503.8
280
100
-70
230
100m @ 5.44% TiO2 from 0m
RC25TOM065
373987
6725899.2
268
100
-71.5
233.9
100m @ 5.22% TiO2 from 4m
RC25TOM066
374476
6725895.3
262
100
-69.9
230.5
94m @ 4.69% TiO2 from 6m
RC25TOM067
374402
6725503.6
274
100
-71.3
235.8
100m @ 5.36% TiO2 from 0m
RC25TOM068
373313
6725106.7
299
100
-70.2
226.9
98m @ 7.05% TiO2 from 2m
RC25TOM069
372755
6725101
310
100
-71.1
224.6
100m @ 1.04% TiO2 from 0m
RC25TOM070
373403
6725899.1
275
100
-69.9
223.7
92m @ 4.97% TiO2 from 8m
RC25TOM071
373176
6725500.5
294
100
-70.4
227.3
100m @ 6.95% TiO2 from 0m
Data aggregation methods
In reporting Exploration Results, weighting averaging techniques, maximum and/or minimum grade truncations (eg cutting of high grades) and cut-off grades are usually Material and should be stated.
Where aggregate intercepts incorporate short lengths of high grade results and longer lengths of low grade results, the procedure used for such aggregation should be stated and some typical examples of such aggregations should be shown in detail.
The assumptions used for any reporting of metal equivalent values should be clearly stated.
Sample compositing has been applied to reported exploration results of diamond drillholes as the sample length of individual samples varies and therefore a weighted average has been used to provide the TiO2 intercepts for those holes.
Relationship between mineralisation widths and intercept lengths
These relationships are particularly important in the reporting of Exploration Results.
If the geometry of the mineralisation with respect to the drill hole angle is known, its nature should be reported.
If it is not known and only the down hole lengths are reported, there should be a clear statement to this effect (eg ‘down hole length, true width not known’).
The drilling at Pitfield has intersected TiO2 mineralisation in nearly every hole and in those holes nearly every hole has finished in mineralisation. Recent drilling in the southwestern corner of the project has drilled into holes that have very low grade mineralisation (<1.5% TiO2). The nature of the sediments is different with these holes being drilled into coarse grained immature sandstones. The results suggest that this is the western edge of the mineralisation, however further drilling to the west of these holes will need to confirm this.
The true width and strike thickness of the mineralisation cannot be reported as the eastern, southern and northern extents of the mineralisation are currently unknow after more than 380 drill holes.
Diagrams
Appropriate maps and sections (with scales) and tabulations of intercepts should be included for any significant discovery being reported These should include, but not be limited to a plan view of drill hole collar locations and appropriate sectional views.
Please refer to figures within the text and previous Empire Metals AIM announcements.
Balanced reporting
Where comprehensive reporting of all Exploration Results is not practicable, representative reporting of both low and high grades and/or widths should be practiced to avoid misleading reporting of Exploration Results.
The Company believes that the AIM announcement is a balanced report with all material results reported.
Other substantive exploration data
Other exploration data, if meaningful and material, should be reported including (but not limited to): geological observations; geophysical survey results; geochemical survey results; bulk samples – size and method of treatment; metallurgical test results; bulk density, groundwater, geotechnical and rock characteristics; potential deleterious or contaminating substances.
Everything meaningful and material is disclosed in the body of the report. Geological observations have been factored into the report and can also be found in previous Empire Metals Ltd AIM announcements.
Further work
The nature and scale of planned further work (eg tests for lateral extensions or depth extensions or large-scale step-out drilling).
Diagrams clearly highlighting the areas of possible extensions, including the main geological interpretations and future drilling areas, provided this information is not commercially sensitive.
Drilling in the next 12 months will consist of several AC, RC and diamond programs. There is infill drilling planned at the Thomas prospect that will be designed to take the inferred resources to indicated and indicated to measured where appropriate. Diamond drilling is planned to aid in the geotechnical understanding of the mineralisation as well as generate samples for metallurgical test work.
An exploration drill program will take place to identify the eastern and western limits of the mineralisation to determine the extent of this giant deposit. This drilling will also aid studies into mine planning and infrastructure location.
A mineral resource drill program with AC and RC will be undertaken at the Cosgrove Project with the aim of delivering a mineral resource estimate that will include both inferred and indicated resources.
Section 3 Estimation and Reporting of Mineral Resources
(Criteria listed in section 1, and where relevant in section 2, also apply to this section.)
Database integrity
Measures taken to ensure that data has not been corrupted by, for example, transcription or keying errors, between its initial collection and its use for Mineral Resource estimation purposes.
Data validation procedures used.
Data is verified by Empire geologists before being placed in the Empire database.
All data is stored and verified in an Access database.
Geological data is captured in Excel logging templates using referential validation. Once checked data is uploaded to MaxGeo Datashed software, managed by an external database consultant.
CSV tables for geological data are exported for use in geological modelling software.
De-surveying (the process of creating a three-dimensional drillhole trace) is conducted in either Leapfrog Geo or Datamine RM Pro. Inbuilt validation checks in both software packages are used to verify the data.
Empire Metals Australia Pty Ltd (Empire) assume responsibility for the validity and accuracy of the data that supports the estimation of Mineral Resources at both Cosgrove and Thomas deposits (Pitfield Project).
Site visits
Comment on any site visits undertaken by the Competent Person and the outcome of those visits.
If no site visits have been undertaken indicate why this is the case.
The competent persons are employees of Empire Metals and have spent time at site.
SnowdenOptiro, geological consultants who have put the MRE model together have been to site to see site activities including AC drilling and sampling and looking at diamond drill core.
A site visit was conducted by Snowden Optiro, who is acting as a technical consultant to Empire.
Snowden Optiro have reviewed drilling and sampling procedures and provided guidance through drill spacing analysis.
Snowden Optiro are independent of Empire Metals Australia Pty Ltd and have no interest in the Project, other than providing technical support through written contractual agreements.
An independent data QA/QC process was undertaken by SnowdenOptiro geological consultants.
Geological interpretation
Confidence in (or conversely, the uncertainty of ) the geological interpretation of the mineral deposit.
Nature of the data used and of any assumptions made.
The effect, if any, of alternative interpretations on Mineral Resource estimation.
The use of geology in guiding and controlling Mineral Resource estimation.
The factors affecting continuity both of grade and geology.
Interpretation of mineralisation geometry is based on geological interpretation of the logging of AC, RC and diamond samples and assay results.
Geological interpretation of the underlying sediments and their current orientation has had a control on the mineralisation. The intense weathering of these sediments and the subsequent alteration of the existing mineralisation upgrading the titanite to anatase has also had a significant impact on the modelling of the deposit.
The deposit is extremely large and very homogeneous in the medium to large scale and therefore the grade and continuity of grade is not affected to any degree.
Geological and material type models have been constructed across both deposits at the Pitfield Project, which has used the extensive geochemical and lithological data available.
Diamond drilling has helped in understanding style of mineralisation at Pitfield and the extent of the weathering overprint (texture and nature of contacts). This work is further supported by multiple technical studies including metallurgy, mineralogy, and petrography.
The underlying geological model should be considered a fair representation of the lithological units at the Pitfield Project. The model is supported by orientated diamond drilling and inclined reverse circulation drilling that has been drilled perpendicular to the stratigraphic sequence. The objective of shallower air core drilling was primarily focused on understanding the depth and lateral extent of weathered cap.
The geological model has been simplified to represent the distribution of the conglomerate horizons, with all other units where not cover or laterite determined to be the remaining Yandanooka silt/sandstone package. The orientation and thickness of the conglomerate can be traced across multiple drill sections. An observation is that the conglomerate interbeds appear to demonstrate a lower grade of titanium mineralisation, than that of the sands/siltstones.
The material model details the distribution of cover (sands/soil/organics), laterite, saprolite (both upper and lower), weathered sandstone/conglomerates (transitional and saprock) and fresh rock.
Secondary weathering processes are interpreted to have acted both vertically and laterally, as such the search and continuity modelling honour this observation. It is plausible that the mineralisation event could be inclined to the east to follow the stratigraphic bedding which strikes northwest-southeast at approximately 340° and dipping 40-65° towards the northeast. However, secondary weathering events are assessed as a higher priority.
Mineralisation is ubiquitous throughout the sandstone package, with a lower modelling cut-off approximately 2% TiO2 demarking a northwest corridor on the western side of the deposits The eastern contact is not fully resolved by drilling and appears more gradational.
Both deposits have undergone extensive haematite-carbonate-epidote-chlorite alteration and an associated titanium mineralisation event. Secondary weathering is pervasive with both lateritic and kaolinsation processes, leading to an extensive ‘weathered cap’ extending to an average of 30-50 m below surface. Weathering has resulted in a chemical alteration of the primary titanite to anatase,. Associated gauge minerals are hematite, quartz, carbonate, and albite (sodium feldspar).
Both deposits share similar characteristics, albeit the weathering profile is deeper at Thomas than that at Cosgrove.
As with all deposits further drilling will improve the geological understanding of the mineralisation/weathering processes. The Competent Person has reflected this in the resource classification applied.
Dimensions
The extent and variability of the Mineral Resource expressed as length (along strike or otherwise), plan width, and depth below surface to the upper and lower limits of the Mineral Resource.
The mineral resource estimate at the Thomas prospect is a subset of the much larger TiO2 mineralisation found at Pitfield. Currently the mineralisation at Pitfield has been identified in drilling over a strike length of 35km and a width of 5km.
The Cosgrove deposit is modelled to cover an area 7.5 km(N) and 4.0 km(E) and to a depth of 400 m.
The Thomas deposit is modelled to cover an area 8.0 km(N) by 5.0 km(E) and to a depth of 400 m.
Estimation and modelling techniques
The nature and appropriateness of the estimation technique(s) applied and key assumptions, including treatment of extreme grade values, domaining, interpolation parameters and maximum distance of extrapolation from data points. If a computer assisted estimation method was chosen include a description of computer software and parameters used.
The availability of check estimates, previous estimates and/or mine production records and whether the Mineral Resource estimate takes appropriate account of such data.
The assumptions made regarding recovery of by-products.
Estimation of deleterious elements or other non-grade variables of economic significance (eg sulphur for acid mine drainage characterisation).
In the case of block model interpolation, the block size in relation to the average sample spacing and the search employed.
Any assumptions behind modelling of selective mining units.
Any assumptions about correlation between variables.
Description of how the geological interpretation was used to control the resource estimates.
Discussion of basis for using or not using grade cutting or capping.
The process of validation, the checking process used, the comparison of model data to drill hole data, and use of reconciliation data if available.
The listed Mineral Resources are the first estimated for the Pitfield Project.
Geological modelling was conducted using Leapfrog Geo software, with statistical and geostatistical evaluation completed using Datamine’s Snowden Supervisor software and estimation and reporting finalised using Datamine Studio RM Pro.
The estimation of Mineral Resources uses all available drill data (air core, reverse circulation, and diamond). Thomas comprises 259 holes, for 18,116 meters of drilling. Cosgrove totals 87 holes for 4,570 metres drilling.
Twin drillhole studies were completed to evaluate and test for sampling bias between drilling methods, given the style of mineralisation no material bias was determined, and no factoring was applied between drill types.
Drilling at the Thomas deposit varies from the close spaced drilling at 100 m by 100 m centres but generally honours a dice five configuration of air core drilled on a 400 m(N) by 200 m(E) grid, which is infilled with an offset grid of reverse circulation drilling using a 400 m(N) by 400 m(E) pattern. All Indicated Resources comprise a drill spacing between 100 m by 100 m (in the close spaced drilling area) and no more than 300 m between drillholes.
Various drillhole spacing exercises were conducted prior to the Mineral Resource Estimate and subsequent 2025 drill campaign. The objective of these studies was to determine the appropriate drill spacing derived from conditional simulation studies. The results from these studies indicated that a drill spacing using an offset grid approximating a 200 m(E) and 400 m(N) grid would be sufficient given the low variability in the grade and homogenous nature of mineralisation, with the deposit sharing parallels with other bulk commodity deposits such as bauxite.
Cosgrove comprises close spaced drilling, like at Thomas, however, lacks the systematic grid drilling which has not been conducted. The classification applied at Cosgrove represents this data configuration.
All geochemical data are reported parts per million, which was converted to percentage All elements of interest were converted to their respective oxide minerals using established stoichiometric conversion ratios. Iron was assessed to be hematite (Fe2O3).
Exploratory data analysis was used to assess lower mineralisation cut-offs. Support from geological modelling indicated a lower threshold approximating 2% TiO2 was reasonable threshold which marks a mineralised corridor, striking northwest-southwest on the western margin. The eastern margin appears more gradational in nature.
Elemental distributions varied between weathering domains, and as such estimation domains were defined from a combination of weathering and mineralisation domains.
Four estimation domains were defined for TiO2, Fe and Al. 500 – cover, 1000 – laterite, 2000 – combined saprolite, weathered and fresh, 3000 – fresh conglomerate. At Thomas these were further sub-divided to account for low grade (100) and higher-grade TiO2 mineralisation.
Six estimation domains were defined for Ca, Mg, Na and K. 500 – cover, 1000 – laterite, 2000 – saprolite, 3000 – weathered, 4000 – fresh and 5000 – fresh conglomerate. These were then further sub-divided on for low and high-grade mineralisation at Thomas.
Cosgrove honoured the same estimation domains, however, did not require the sub-domaining for grade mineralisation as the western margin has not been clearly defined.
All data was composited honouring material type domains. The compositing length chosen was 2 m and reflects the typical sampling interval as most of the drill data was derived from air core or reverse circulation drilling. No residuals were discarded, and metal checks confirmed the validity of the compositing process.
No top-cutting was required due to the low coefficients of variation exhibited by the sample population and typical for this style of mineralisation.
All the elements used their own variogram models but honoured the same sample neighbourhoods and search orientations.
Variograms were modelled separately for each deposit using normal scores transformed data, which was back transformed on export. At Thomas, the nugget effect was modelled at <20% of total variance, with the remaining three structures modelled at 155 m (0.31), 285 m (0.11), and 535 m (0.41). The variogram is aligned 000->345 for the major direction, 00->255 for the semi-major and 90->000 for the minor (vertical). Cosgrove has less data outside of the closely spaced drill area. At Cosgrove, the nugget effect accounted for approximately 25% of variance of the data. The remaining two structures were modelled at 125 m(0.316) and 375 m(0.435). The orientations were like Thomas, however favoured a slight rotation of the major to 00->340 was used, with 00->070 for the semi-major and 90->00 for the minor.
TiO2, was estimated into parent block cells using ordinary kriging. The parent blocks were discretised to a 5 by 5 by 5 grids of points. The block size was chosen from a consideration of mining selectivity, kriging neighbourhood analysis and drillhole sample configuration.
A parent block size of 50 m(X) by 50 m(Y) by 10 m(Z) was used with sub-celling 2 m in all directions permitted.
The block model was coded for material type, lithology, mineralisation domains.
A three-pass estimation strategy was adopted.
The first pass searching to the full range of the modelled variograms for TiO2 analyte and using a minimum of ten and a maximum of 20 samples and a bore hole restrictor of a max of five samples from anyone hole.
The second pass expanded the search radius by 1.5 times, whilst maintaining the sample pairs and bore hole restrictor.
The third pass used a further expanded search criteria of three times, however with a reduction in sample pairs to a minimum of five and maximum of ten samples, maintaining the bore hole restrictor of five samples per hole.
Any blocks not estimated in three passes were hard coded the mean grade of the estimation domain and flagged in the model and excluded from classified resources.
Due to the size of the deposits and extrapolation on the margins, validation was only conducted on classified resources and corresponding samples within the classified resource perimeter. This comprised an assessment of the kriging metrics (kriging variance, efficiency, and slope of regression). An assessment of number of samples used the average distance of samples to the block centre and drill hole spacing. Additionally, previous conditional simulation drillhole spacing studies were compared back to the ordinary kriged estimate.
Density was assigned based on weathering (see density section).
Internal workings were captured in a supporting Mineral Resource workbook, which documents decision points and analysis.
Grade tonnage sensitivity reporting was assessed using incremental cut-offs of 0.5% from 0% to 6% TiO2.
Moisture
Whether the tonnages are estimated on a dry basis or with natural moisture, and the method of determination of the moisture content.
Tonnes have been estimated on a dry basis.
Cut-off parameters
The basis of the adopted cut-off grade(s) or quality parameters applied.
A marginal cut-off grade of 2.36% TiO2 is calculated is derived from Total ore cost / (Process recovery*(Price*(1-Royalty)-Product Transport))*100
The Mineral Resource is reported above a 2.5% TiO2 cut-off.
Sensitivity to cut-off grade is presented in the main body of the text along with a grade-tonnage curve.
Mining factors or assumptions
Assumptions made regarding possible mining methods, minimum mining dimensions and internal (or, if applicable, external) mining dilution. It is always necessary as part of the process of determining reasonable prospects for eventual economic extraction to consider potential mining methods, but the assumptions made regarding mining methods and parameters when estimating Mineral Resources may not always be rigorous. Where this is the case, this should be reported with an explanation of the basis of the mining assumptions made.
Reasonable Prospects of Economic Extraction have been demonstrated for both Cosgrove and Thomas deposits via the use of an optimised pit shell (RF1) to spatially constrain the Mineral Resources.
Mining is expected to reflect a bulk mining scenario via conventional truck and shovel equipment. However, no studies have been conducted at this stage due to no declared Mineral Resources existing for Pitfield.
The region is well services by infrastructure; rail and road and port facilities located within 120 km of Geraldton. The Three-Springs area comprises gas and high voltage infrastructure. Empire is also assessing low carbon options such as wind/solar and potentially geothermal energy.
The optimisaiton has assumed certain early-stage engineering criteria which are outlined below for transparency.
No dilution or recover modifiers have been applied, assuming a bulk mining scenario and inline with Mineral Sands operations
A process recovery of 70% is applied irrespective of weathering type.
A titanium product price of US$2,500/t is supported with the production of a high value finishing product. Empire provided guidance to Snowden Optiro, which reflects a conservative five-year historical Tier-1 pigment price, informed by industry expert TiPMC
Mining cost is estimated at US$3/t with an incremental ore cost of US$0.5/t and inline with other bulk commodity costs.
Processing costs are estimated at US$38/t and assume that a high value end use product is produced. Further work is required with respect to locating a suitable hydromet facility.
G&A costs are envisaged to be US$1.5/t.
Transport costs are benchmarked by noting a 160 km haulage to Geraldton Port at US$20/t.
State royalty is benchmarked at 2.5%.
Geotechnical parameters range between 40-45 degrees for open pit wall angles. The open pit is expected to be shallow targeting the weathered cap.
Metallurgical factors or assumptions
The basis for assumptions or predictions regarding metallurgical amenability. It is always necessary as part of the process of determining reasonable prospects for eventual economic extraction to consider potential metallurgical methods, but the assumptions regarding metallurgical treatment processes and parameters made when reporting Mineral Resources may not always be rigorous. Where this is the case, this should be reported with an explanation of the basis of the metallurgical assumptions made.
Metallurgical testwork has been undertaken on a range of samples from the exploration program.
Focus of the testwork has been on the weathered zones.
Multiple samples from diamond drilling and AC drilling programmes have been selected for metallurgical testwork. The program has three key areas – understanding the mineralogy and physical characteristics of the mineralisation that influence metallurgical performance, mineral separation process development and elemental extraction process development.
Testwork is being managed by Empire Metals’ technical team and being undertaken at a number of commercial laboratories in Perth, Western Australia.
Progress results have been reported, including most recently:
“Breakthrough in Process development 28/08/25
“Team Expansion and Bulk Met testing commences” 16/07/25
“Significant Progress Achieved on Process Flowsheet” 13/02/25
This work is unoptimized, and further testwork is in progress and planned. A wide range of possible flowsheets are still being assessed for metallurgical performance and cost.
The metallurgical development testwork is being undertaken in conjunction with engineering studies. A desk top study is currently in progress, with plans to complete more detailed studies as the testwork program and wider project progresses
Empire Metals Australia Pty Ltd has committed substantial financial resources to the development of metallurgical flowsheets and commercialisation of different titanium products (high and low-value products, pigments, feedstock, or sponge metals).
The approach has involved extensive metallurgical field programmes on exploration diamond core, bulk samples, and finalised test products. This is supported by a dedicated full-time Process Development Manager, Commercial Manager and Marketing Manager.
The most recent test work (see announcement dated 4 September 2025) indicates that a conceptual flow sheet using conventional processing routes can produce a high-purity (+99% TiO2 product). Additionally, that the mineralisation and potential ore is non-refractory and free of deleterious elements (radioactive elements, phosphorus, vanadium, chromium). Recoveries from the weathered material are expected to achieve between 67-77%.
Early metallurgical test work focused on fresh mineralisation which demonstrated viability. Empire’s focus has now shifted towards the weathered cap due to the shallow and lateral extent of this horizon and amenability to traditional processing routes.
Detailed mineralogical test work has been collected using TIMA and XRD analysis on metallurgical drill core samples and supported by microprobe analysis conducted by CSIRO in Melbourne.
Future studies are on track to address scalability studies / bulk material handling trials and pilot plant processing.
Commercialisation and/or product marketing studies are ongoing to understand end user requirements and sales and marketability of final products.
Environmen-tal factors or assumptions
Assumptions made regarding possible waste and process residue disposal options. It is always necessary as part of the process of determining reasonable prospects for eventual economic extraction to consider the potential environmental impacts of the mining and processing operation. While at this stage the determination of potential environmental impacts, particularly for a greenfields project, may not always be well advanced, the status of early consideration of these potential environmental impacts should be reported. Where these aspects have not been considered this should be reported with an explanation of the environmental assumptions made.
Empire Metals Australia Pty Ltd is not aware of any current constraints pertaining to ESG. With current land holder agreements in place and in good standing.
Preliminary metallurgical test work does not identify any deleterious elements that would feature in waste rock.
Any waste rock landforms are likely to comprise inert material with no known PAF forming capability and situated adjacent to open pits given the bulk mining methods envisaged.
Concept studies suggest that back filling of the shallow open pits is viable once the saprolite and weathered material has been mined.
The deposits are located on disturbed farming freehold land, with no native title issues identified at this stage. The Pitfield tenure falls under Yamatji Southern Regional Corporation.
Empire Metals Australia Pty Ltd also employees a full time Environmental Manager.
Base line studies are well advanced, and into their second years of study for ecology, noise, and dust.
Options for process waste storage facilities have been discussed, including volumes, types, potential environmental impact, potential for reuse and form in which the wastes will be stored. Locations for the waste storage facilities are being considered. Multiple options are being discussed.
Bulk density
Whether assumed or determined. If assumed, the basis for the assumptions. If determined, the method used, whether wet or dry, the frequency of the measurements, the nature, size and representativeness of the samples.
The bulk density for bulk material must have been measured by methods that adequately account for void spaces (vugs, porosity, etc), moisture and differences between rock and alteration zones within the deposit.
Discuss assumptions for bulk density estimates used in the evaluation process of the different materials.
Bulk density determined using diamond drill core samples.
Density has been assigned based on material type (weathering horizon).
Density is determined from bulk density measurements conducted on 40 drill core samples analysed at ALS, Perth. The measurements consider material type, moisture and grainsize. A dry bulk density value is determined through the water immersion method.
The values applied are listed below:
Cover – 1.7 t/m3
Laterite – 1.78 t/m3
Saprolite – 2.02 t/m3
Weathered sandstone/conglomerate – 2.14 t/m3
Fresh sandstone/conglomerate – 3.07 t/m3
Additional bulk density measurements will be routinely collected as further diamond drilling and metallurgical studies are conducted.
There is the risk that the density assumptions may be over-or-underestimated given the scale of the deposit. The Competent Person considers that the density measurements are generally conservative for the weathered cap, and the fresh density is reliable given the homogenous nature of the sandstone.
The accuracy in the assignment of density is acceptable given that there will be variance in the exact position of the weathering surfaces due to uncertainty between drillholes.
Classification
The basis for the classification of the Mineral Resources into varying confidence categories.
Whether appropriate account has been taken of all relevant factors (ie relative confidence in tonnage/grade estimations, reliability of input data, confidence in continuity of geology and metal values, quality, quantity and distribution of the data).
Whether the result appropriately reflects the Competent Person’s view of the deposit.
Resources classified based on confidence in geological interpretation, and QA/QC of assay data.
Empire Metals Australia Pty Ltd Exploration Manager Andrew Faragher is acting as the Competent Person who the purposes of reporting Mineral Resources under the 2012 version of the JORC Code. Mr. Faragher is a member of AusIMM (Australian Institute of Mining and Metallurgy).
Mineral Resources have been classified in accordance with the 2012 version of the JORC Code. The following criteria have been applied to determine Indicated and Inferred Resources.
Inferred Resources are classified whereby:
Kriging variance is below 0.6.
Where the average distance from the block centre to all samples used for estimation was less than 350 m.
In addition, no further than 20 m extrapolation below the base of the air core drilling (creating uniform, best fit surface).
Indicated Resource are classified whereby:
The kriging variance is below 0.45.
Where the average distance from the block centre to all samples used for estimation approximated 200 m or less.
Resources have been tested using air core, reverse circulation, and diamond drilling.
Metallurgical test work has been conducted to a suitable study level to demonstrate recovery viability.
Where drill spacing gaps exist between fence lines due to native flora.
No resources have been classified as Measured.
All reportable resources are constrained to an open pit optimisation (revenue factor 1 shell) demonstrating Reasonable Prospects for Eventual Economic Extraction (RPEEE). Mineral Resources are reported above a 2.5% TiO2 cut-off which is above the calculated marginal cut-off of 2.36% TiO2.
The classification applied appropriately reflects the Competent Person’s view of the location and confidence in the Mineral Resource estimate.
Audits or reviews
The results of any audits or reviews of Mineral Resource estimates.
The Mineral Resources have been reviewed by Snowden Optiro, who are acting as an independent technical consultancy to Empire Metals Australia Pty Ltd and who have no commercial interest in the Project.
Discussion of relative accuracy/ confidence
Where appropriate a statement of the relative accuracy and confidence level in the Mineral Resource estimate using an approach or procedure deemed appropriate by the Competent Person. For example, the application of statistical or geostatistical procedures to quantify the relative accuracy of the resource within stated confidence limits, or, if such an approach is not deemed appropriate, a qualitative discussion of the factors that could affect the relative accuracy and confidence of the estimate.
The statement should specify whether it relates to global or local estimates, and, if local, state the relevant tonnages, which should be relevant to technical and economic evaluation. Documentation should include assumptions made and the procedures used.
These statements of relative accuracy and confidence of the estimate should be compared with production data, where available.
Mineral Resources has been classified using a combination of geological, metallurgical, geostatistical and drill spacing parameters. Additionally demonstrate and satisfy the RPEEE criterion using both a spatial constraint (optimised pit shell and suitable reporting cut-off grade).
The relative accuracy of the Pitfield MRE is reflected in the reporting of Mineral Resource in accordance with the 2012 version of the JORC Code.
The Mineral Resource statement relates to the global estimate of tonnes and grade.
No production data or previous estimates are available for comparison.
This information is provided by RNS, the news service of the London Stock Exchange. RNS is approved by the Financial Conduct Authority to act as a Primary Information Provider in the United Kingdom. Terms and conditions relating to the use and distribution of this information may apply. For further information, please contact [email protected] or visit www.rns.com.