Minera Alamos Announces Positive Pre-Feasibility Study for the Copperstone Gold Project in Arizona
Board of Directors Approves Fast-Track Construction
Toronto, Ontario–(Newsfile Corp. – May 27, 2026) – Minera Alamos Inc. (TSXV: MAI) (OTCQX: MAIFF) (“Minera Alamos” or the “Company“) is pleased to announce the results of a pre-feasibility study (the “PFS“) on its 100%-owned, past-producing Copperstone project (“Copperstone” or the “Project“) located in La Paz County, Arizona, USA. A technical report for the Copperstone PFS is being prepared in accordance with National Instrument 43-101 (“NI 43-101“) and will be filed under the Company’s profile on SEDAR+ and on the Company’s website within 45 days of this news release.
All dollar amounts in this news release are expressed in U.S. dollars, unless otherwise noted. Metric tonnes are referred to as “t”, imperial short tons as “st”, grams as “g”, gold as “Au”, troy ounces as “oz”, thousands of troy ounces as “koz”, and millions as “M”.
Copperstone Pre-Feasibility Highlights
-
Strong project economics:
-
At base case gold price of $3,500/oz, after-tax net present value 5% (“NPV5%”) of $374 M, internal rate of return (“IRR”) of 108%, payback period of 1.2 years, and net cashflow of $512 M.
-
At spot gold price of $4,500/oz, after-tax NPV5% of $537 M, IRR of 154%, payback period of 0.8 years, and net cashflow of $725 M.
-
-
Resilient, low-cost mine plan: PFS life-of-mine (“LOM”) plan shows an initial 6.3-year mine life producing a total of 291 koz gold with average annual production of 46 koz at total cash costs1 of $1,070/oz gold and all-in sustaining costs1 (“AISC”) of $1,314/oz gold.
-
Initial production anticipated in mid-2027, more than doubling the Company’s projected annual gold production: Based on the PFS results and current estimates, project construction is expected to take approximately one year, with initial gold production anticipated by mid-2027. Given Copperstone’s average annual production of 46 koz gold per year, the project has the potential to more than double the Company’s consolidated annual gold production, as compared with the 2026 guidance for 32 koz – 38 koz from the Pan mine in Nevada.
-
Low capital intensity: Total initial capital cost (“capex”) of $58 M and sustaining capex of $77 M over the LOM. Based on initial capex, the Project has a NPV-to-capex ratio of 6.4x using base case gold price of $3,500/oz, and NPV-to-capex ratio of 9.2x using spot gold price of $4,500/oz. The initial capex of $58 M to be comfortably financed by the Company’s existing cash balance (Q1 2026, $46 M), excess capacity under the recently closed $75 M revolving credit facility, and ongoing cash flow from the Pan mine in Nevada.
-
Increased Resources and maiden Reserves: Increased Measured & Indicated (“M&I”) Resources to 4,054 kt grading 4.83 grams per tonne gold (“g/t”) and containing 630 koz gold, representing a 110% increase in contained gold ounces compared to the previous mineral resource estimate. Maiden Proven & Probable Reserves are 1,934 kt grading 4.87 g/t and containing 303 koz gold.
-
Fully permitted for construction: Copperstone is a previously mined property with active mining and environmental permits.
-
Significant exploration potential to increase mine life: Approximately half of the Measured & Indicated Resources were not converted to Reserves. Further drilling, mine development, and mine optimization could increase the likelihood of future conversion to Reserves. Additionally, the down-plunge extension potential of the underground mineralization will be further evaluated from underground drill stations after production starts, where much of the known mineralized zones are open at depth.
-
Additional Open Pit Potential: The Copperstone project has an extensive history of both open pit and underground mining. For the purposes of the updated Copperstone PFS, only underground accessible Resources were considered. A portion of these Resources exist in near-surface areas in proximity to the historic open pit excavations (“Open Pit Potential”), and the Company believes there is potential for gold mineralization to be extracted via open pit mining methods.
1 Total cash costs and AISC are non-IFRS measures. For more details refer to the “Non-IFRS Measures” section of this release.
Darren Koningen, President & COO, commented, “The Copperstone PFS results show a high-return, low capital underground gold mining project with first gold production anticipated in mid-2027 and which will more than double our Company’s annual gold production once ramped up. Our Board has made a formal investment decision for construction of the Copperstone project, with full-scale engineering, procurement and construction activities commencing in June, and mobilizing the underground mining contractor in the near-term. The increase in initial capital cost versus the 2025 PEA allows for an expanded process plant capable of increasing throughput from 600 tons per day to 1,000 tons per day. In addition, a planned 3-month ore stockpile ahead of mill startup helps to de-bottleneck the commissioning and ramp-up of the project.
“The PFS represents an excellent starting point for the project while the Company continues to evaluate opportunities for resource expansion underground and potentially including a new open pit.”
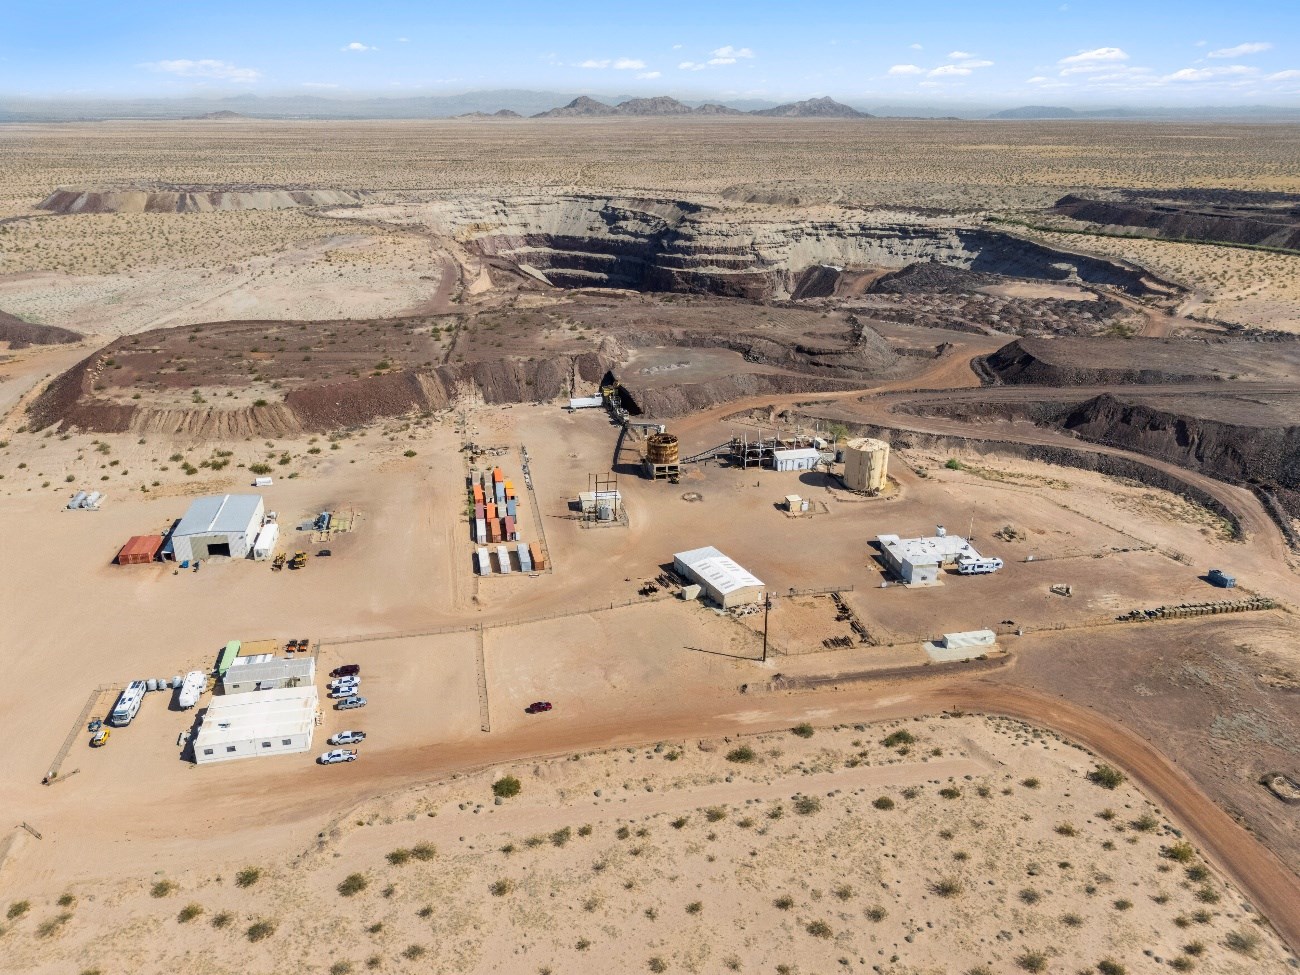
Figure 1 – Copperstone project site overview
To view an enhanced version of this graphic, please visit:
https://images.newsfilecorp.com/files/4183/299120_2dc5bec7e433daaf_003full.jpg
Pre-Feasibility Study Summary
Table 1 – Copperstone PFS Highlights
| PROJECT HIGHLIGHTS | |
| Total ore mined (k tonnes) | 1,934 |
| Average grade (g/t Au) | 4.87 |
| Gold ounces mined (koz) | 303 |
| Mine life (years) | 6.3 |
| Mill throughput year 1 (t/day) | 544 |
| Mill throughput years 2-8 (t/day) | 907 |
| Gold recovery (%) | 96% |
| LOM gold ounces produced (koz) | 291 |
| LOM average annual production (koz) | 46.3 |
| Peak annual production (koz) | 53.9 |
| OPERATING AND CAPITAL COSTS | |
| Mining cost ($/tonne ore mined) | $98.39 |
| Processing cost ($/tonne processed) | $23.79 |
| G&A cost ($/tonne processed) | $8.06 |
| Transport & Refining cost ($/tonne processed) | $2.01 |
| Total site operating cost ($/tonne processed) | $132.24 |
| Total cash costs ($/oz sold) | $1,070 |
| AISC ($/oz sold) | $1,314 |
| Pre-production capital ($ million) | $52.4 |
| Contingency capital ($ million) | $5.9 |
| Total initial capital ($ million) | $58.3 |
| Sustaining capital ($ million) | $76.9 |
| PROJECT ECONOMICS | |
| Base case $3,500/oz gold price | |
| LOM average annual cashflow ($ million) | $91 |
| Total cumulative cashflow ($ million) | $512 |
| After-tax NPV5% ($ million) | $374 |
| After-tax IRR (%) | 108% |
| Payback period (years) | 1.2 |
Table 2 – Copperstone PFS After-Tax Gold Price Sensitivity
| Gold Price ($/oz) |
After-tax NPV5% ($M) |
IRR (%) |
Payback period (years) |
Net Cashflow (undiscounted $M) |
| $2,500 | $214 | 64% | 1.8 | $302 |
| $2,750 | $255 | 75% | 1.6 | $355 |
| $3,000 | $294 | 86% | 1.4 | $407 |
| $3,250 | $334 | 97% | 1.3 | $460 |
| $3,500 | $374 | 108% | 1.2 | $512 |
| $3,750 | $414 | 119% | 1.1 | $564 |
| $4,000 | $455 | 131% | 1.0 | $618 |
| $4,250 | $496 | 142% | 0.9 | $671 |
| $4,500 | $537 | 154% | 0.8 | $725 |
| $4,750 | $577 | 165% | 0.8 | $779 |
| $5,000 | $618 | 177% | 0.7 | $832 |
Property Location, Access, and Infrastructure
The Copperstone property is located 125 miles west of Phoenix, Arizona and is accessed via Interstate I-10 to the town of Quartzsite, Arizona. The site access road is located about 9 miles north of Quartzsite along US Highway 95. The access road is a well-maintained gravel road, the Cyprus Mine Road, that travels west for 5.5 miles to the project site.
The Project is situated on the flat, sandy desert terrain of the La Posa Plain, at the northeastern end of the Dome Rock Mountains, and is surrounded by a natural desert scrub environment. Major supply centres and ample skilled and unskilled labour are available locally, in Phoenix and in Yuma. Access to the Sante Fe rail line is available nearby, and international air service and railway access are both available in Phoenix.
The project benefits from the presence of significant existing operations infrastructure including power distribution, buildings, roads, tailings storage facility, water rights, and part of the process facility.
Updated Mineral Resource Estimate
The Copperstone mineral resource estimate (“MRE”) is presented in Table 3 below.
The MRE is reported at an underground mining cut-off of 0.064 oz/ton gold (2.2 g/t Au). Resources were estimated using an inverse-distance-squared methodology within an overall indicator-kriged model boundary to approximately delineate the boundary between mineralized and unmineralized material. After the block grade estimations were complete, Deswik Stope Optimizer was used as a guide to generate mineralized zones based on $3,000/oz gold price and minimum mining widths and economic parameters consistent with the type of mineral system present at Copperstone. This Resource is considered by the author to have reasonable prospects for eventual economic extraction.
Table 3 – Copperstone Mineral Resource estimate, effective December 1, 2025
| Classification | Tonnes (kt) |
Au Grade (g/t) |
Contained Gold (koz Au) |
| Measured | 2,198 | 5.08 | 359 |
| Indicated | 1,856 | 4.54 | 271 |
| Total Measured & Indicated | 4,054 | 4.83 | 630 |
| Inferred | 401 | 4.04 | 52 |
Notes to Mineral Resource estimate:
- The effective date of the Mineral Resource Estimate is December 1, 2025
- The Mineral Resource Estimate has been classified in accordance with the CIM Definition Standards for Mineral Resources and Mineral Reserves (2014) incorporated by reference into NI 43-101, and CIM Estimation of Mineral Resources and Mineral Reserves Best Practice Guidelines (2019).The estimate of mineral resources may be materially affected by environmental, permitting, legal, marketing or other relevant issues.
- The mineral resource is reported at an underground mining cut-off of 0.064 oz/ton (2.2 g/t Au) within estimated blocks which meet the criteria of a minable shape (minimum mining width of 9ft). The cut-off is based on the following assumptions: a gold price of $3,000/oz; assumed mining cost of $102.87/ton ($113.16/tonne), process costs of $42.64/ton ($46.90/tonne), general and administrative and property/severance tax costs of $16.39/ton ($18.03/tonne), refining and shipping costs of $12.00/oz, a metallurgical recovery for gold of 95%, and a 4.5% gross royalty.
- Resources are reported using at a minimum overall gold cut-off grade of 0.064 oz/ton Au (2.2 g/t Au). Internal dilution is incorporated into the MSO shape volumes as part of the estimated quantities and grades.
- Previously mined areas were modelled based on all available records and were excluded from reporting of this mineral resource.
- Mineral Resources are reported inclusive of Mineral Reserves. Mineral Reserves are estimated from Measured and Indicated Mineral Resources. Inferred Mineral Resources are not included in the Mineral Reserves.
- Mineral Resources that are not Mineral Reserves do not have demonstrated economic viability and may be materially affected by modifying factors including but not restricted to mining, processing, metallurgical, infrastructure, economic, marketing, legal, environmental, social and governmental factors.
- There has been insufficient exploration to define the Inferred Resources tabulated above as an Indicated or Measured Mineral Resource, however, it is reasonably expected that the majority of the Inferred Mineral Resources could be upgraded to Indicated Mineral Resources with continued exploration. There is no certainty that any part of the Mineral Resources estimated will be converted into Mineral Reserves.
- Numbers in the table have been rounded to reflect the accuracy of the estimate and may not sum due to rounding.
- Scott Zelligan, P. Geo. is responsible for reviewing and approving the Copperstone mine underground Mineral Resource Estimate. Mr. Zelligan is a Qualified Person (“QP”) as set out in NI 43-101
Mineral Reserve Estimate
The mineral reserves for the Copperstone underground gold project are estimated in accordance with the CIM Definition Standards. Measured mineral Resources are converted to Proven Reserves, while Indicated mineral Resources are converted to Probable Reserves. Inferred Resources are excluded from the reserve calculation and are treated as waste.
Table 4 – Copperstone Mineral Reserve estimate, effective December 1, 2025
| Classification | Tonnes (kt) |
Au Grade (g/t) |
Contained Gold (koz Au) |
| Proven | 1,052 | 5.06 | 172 |
| Probable | 882 | 4.61 | 131 |
| Total Proven & Probable | 1,934 | 4.87 | 303 |
Notes to Mineral Reserve estimate:
- The effective date for the Mineral Reserve is December 1, 2025
- The Mineral Reserve Estimate has been classified in accordance with the CIM Definition Standards for Mineral Resources and Mineral Reserves (2014) incorporated by reference into NI 43-101.
- Costs were based on the operating costs ranges as outlined in Table 1.
- Mineral Reserves were estimated using a gold price of $3,000/oz, metallurgical recovery of 95%, and a cut-off grade of 0.0642 oz/ton Au (2.2 g/t Au). Mining recovery of 95% and external dilution of 10% at zero grade applied.
- Inferred mineral resources are not mineral reserves and do not have demonstrated economic viability. Inferred resources are excluded from this reserve estimate and treated as waste.
- Numbers are rounded to the nearest ton or ounce; rounding may cause minor discrepancies in totals.
- Reserves are contained within the measured and indicated mineral resources. No additional material has been added.
- Peter Szkilnyk, P.Eng., is responsible for reviewing and approving the Copperstone mine underground Mineral Reserve Estimate. Mr. Szkilnyk is a Qualified Person (“QP”) as set out in the NI 43-101.
Mine Design and Production Profile
The proposed mining method for the Copperstone Project is an overhand mechanized cut-and-fill approach utilizing cemented rock fill. This method was selected for its flexibility in efficiently extracting ore from zones with low vein dip angles. It also helps minimize dilution through precise geological control and disciplined mining practices. Underground mining methods were evaluated with the objectives of minimizing dilution, capital and operating costs, and maximizing resource recovery while sustaining the planned mill throughput. The Copperstone mineralization is relatively shallow, with an average dip of approximately 38 degrees. Although certain zones exceed a 45-degree dip and can be mined using gravity-assisted methods, most of the deposit is too flat to be efficiently mined using long hole stoping.
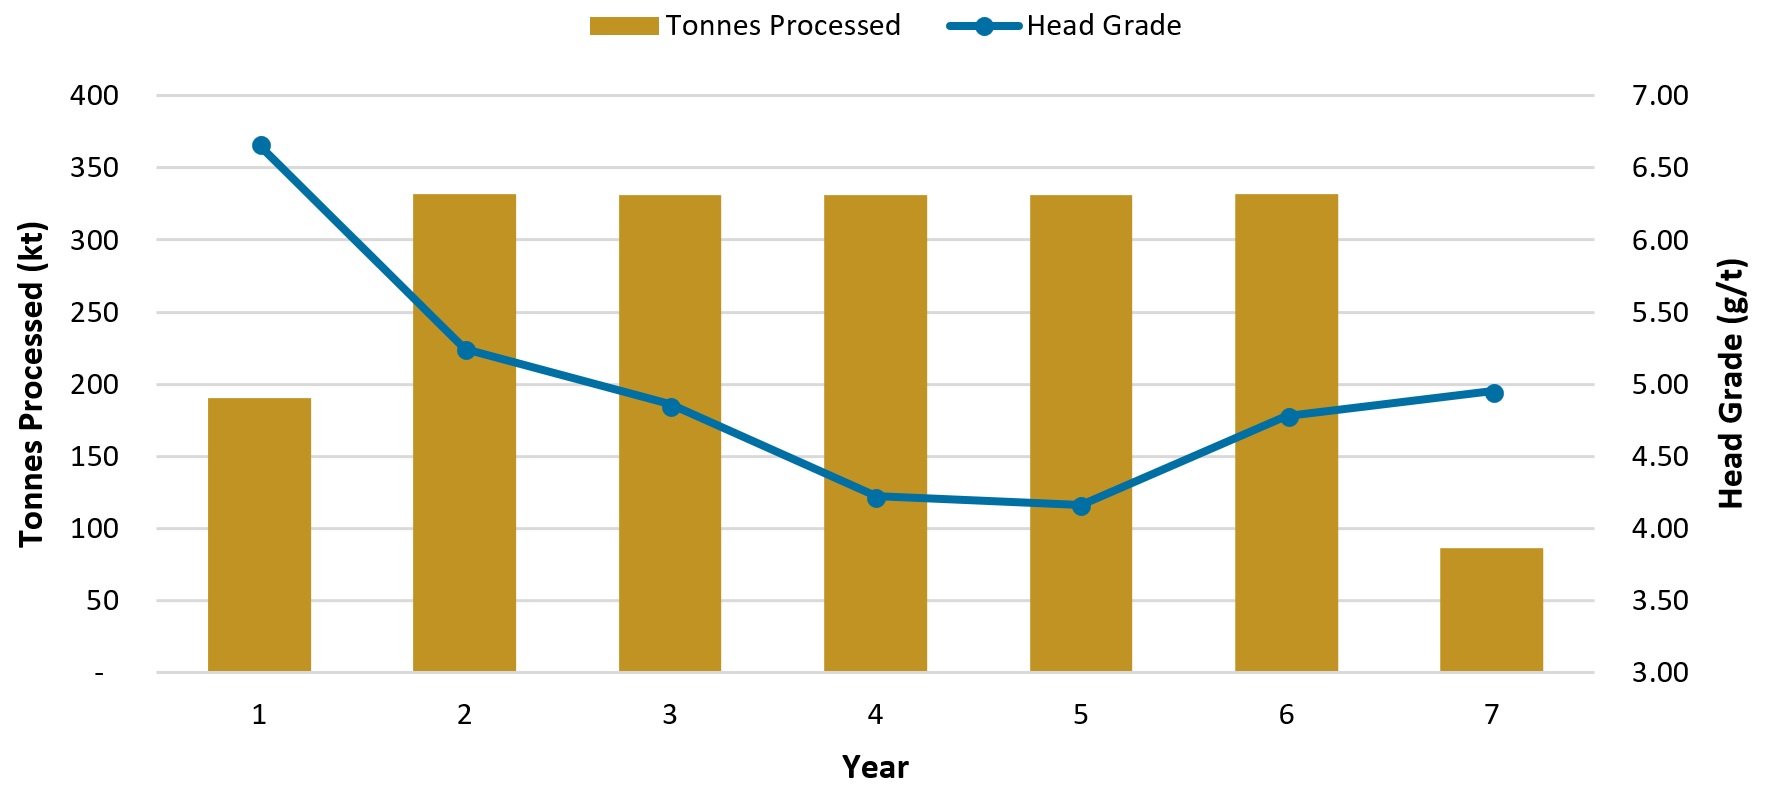
Figure 2 – Copperstone PFS LOM Plan Tonnes and Grade
To view an enhanced version of this graphic, please visit:
https://images.newsfilecorp.com/files/4183/299120_minera-figure2.jpg
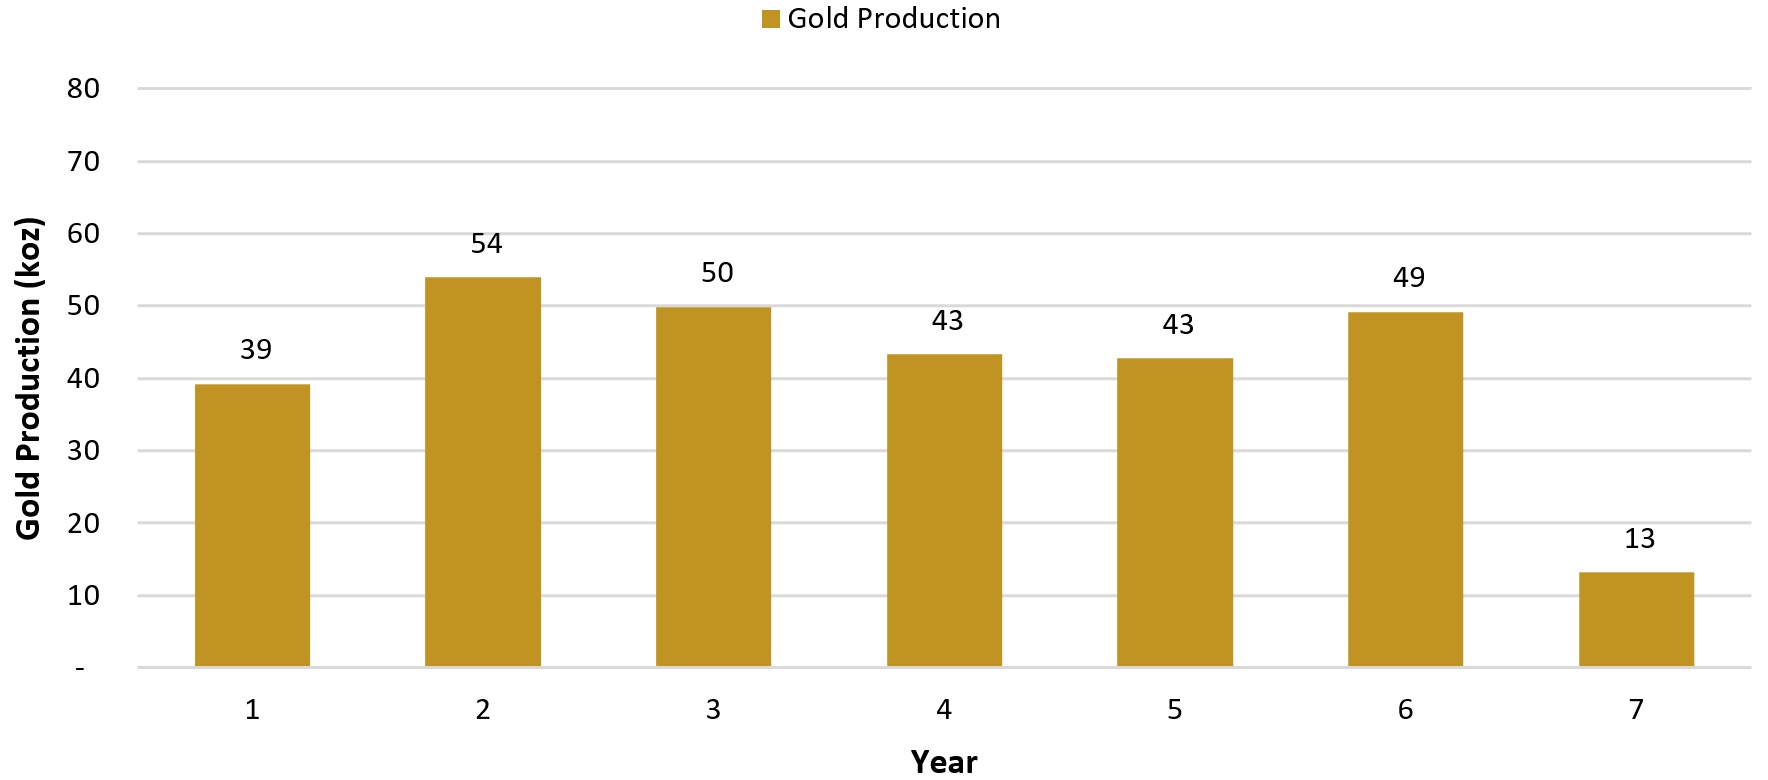
Figure 3 – Copperstone PFS LOM Plan Production
To view an enhanced version of this graphic, please visit:
https://images.newsfilecorp.com/files/4183/299120_minera-figure3.jpg
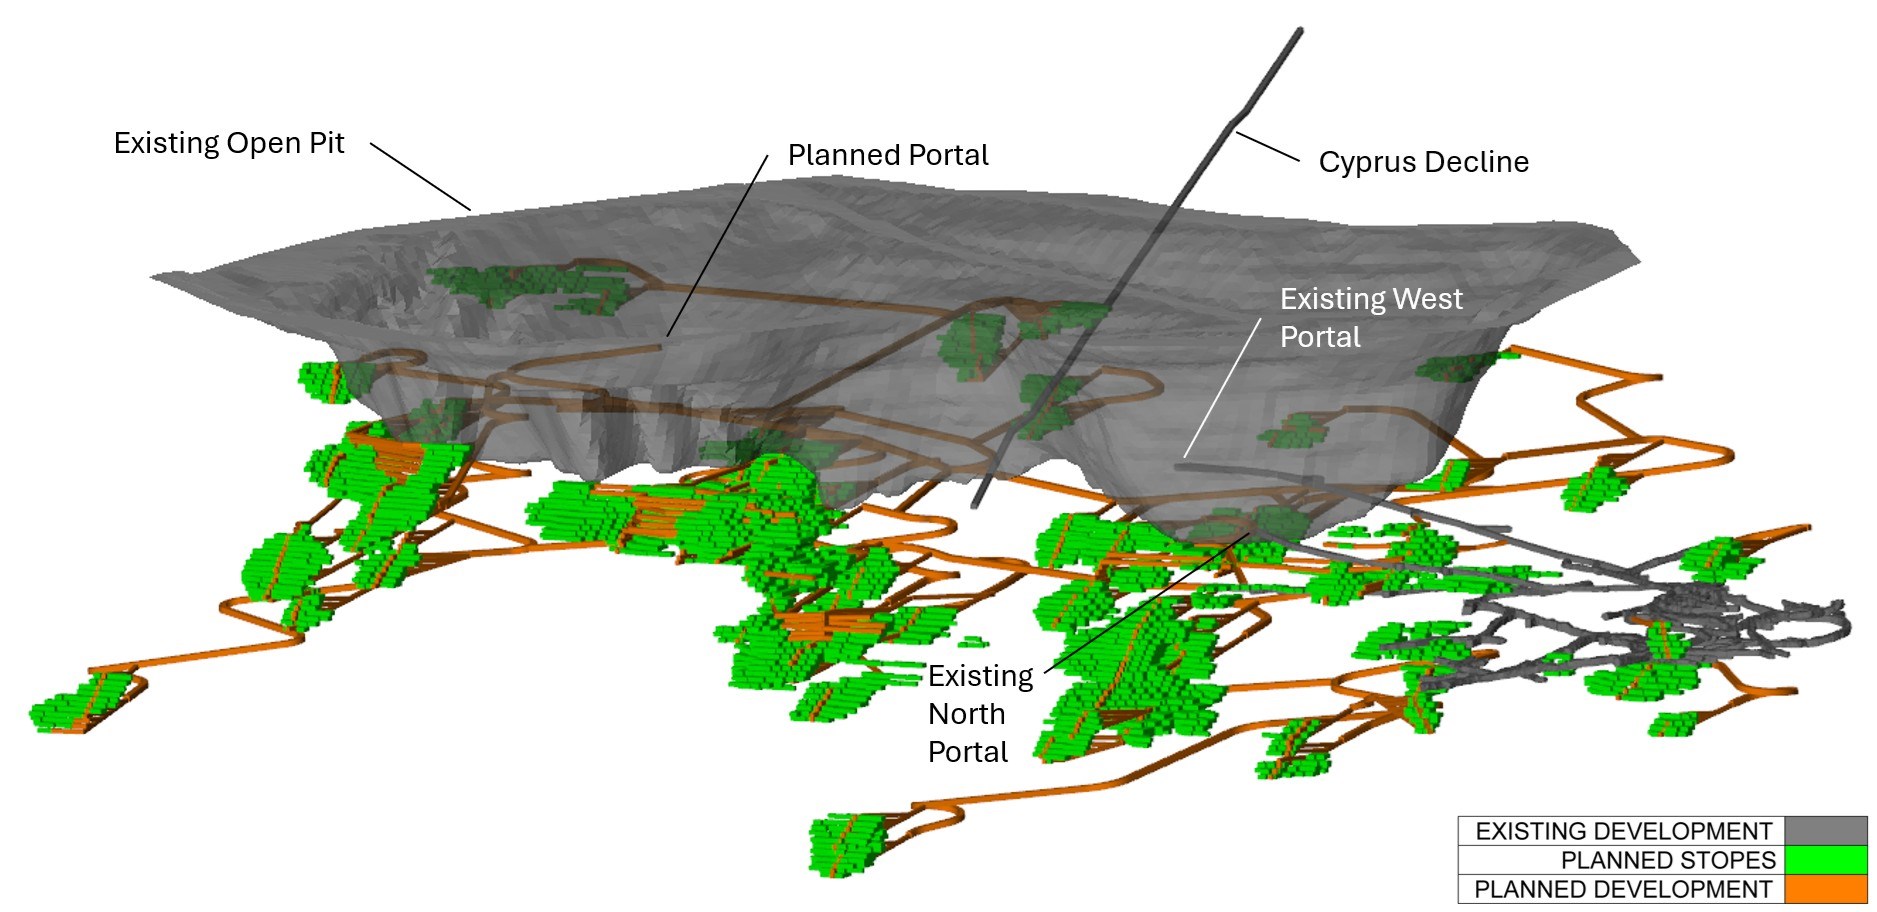
Figure 4 – Copperstone Underground Mine Design (looking southwest)
To view an enhanced version of this graphic, please visit:
https://images.newsfilecorp.com/files/4183/299120_2dc5bec7e433daaf_006full.jpg
Process Plant Design
The proposed flowsheet will incorporate crushing, grinding, flotation, and cyanide leaching circuits to produce a gold concentrate and gold-loaded carbon products. The saleable gold concentrate will be shipped to a port on the west coast for shipping to a refinery, while the loaded carbon will be transported to the Company’s Pan mine processing facility for further processing (refining). The “hybrid” process was selected to provide maximum flexibility to maintain overall high gold recoveries regardless of fluctuations in the mineralization recovered from the mine.
The process plant is designed wherever possible to maximize the use of existing plant infrastructure and equipment, including the primary and secondary crushers, screens, ore bin conveyors, laboratory, and electrical distribution systems. The plant has been designed with an anticipated availability of 92% and projected overall gold recovery of approximately 96%. Initial effective processing capacity is expected to be 544 tpd (600 stpd) during the first year of operations, increasing to 907 tpd (1,000 stpd) from the second year onward.
Tailings Storage Facility
Part of the existing infrastructure at the Copperstone project is a previously constructed and permitted tailings storage facility (“TSF”). Based on current production rate assumptions used in the PFS, the existing TSF is estimated to provide approximately 1.5 years of tailings storage capacity. The Company has planned a TSF expansion to accommodate production beginning late in year 1 of operations, with an additional lift planned later in the mine life. These planned expansions are already considered in the TSF permits for the project.
Operating Cost Estimates
The operating costs include the ongoing cost of operations related to mining, processing, tailings disposal, and general administration activities. The operating costs were determined based on the Company’s in-house database of projects and studies, budgetary mining contractor quotes and data/estimates provided by GR Engineering Services Inc. (“GRES”). LOM average costs are summarized in the table below.
Table 5 – Operating Cost Summary
| Operating Costs | $/oz Au | $/tonne ore |
| Total Mining | $654 | $98.39 |
| Total Processing | $158 | $23.79 |
| Total Site G&A | $53 | $8.06 |
| Transportation and Refining | $13 | $2.01 |
| Cash Operating Costs | $878 | $132.24 |
| Royalties | $158 | $23.71 |
| Production Taxes | $34 | $5.19 |
| Total Cash Costs | $1,070 | $161.15 |
| Corporate G&A | $10 | $1.55 |
| Reclamation cost – prorated | $17 | $2.59 |
| Exploration costs – sustaining | $28 | $4.16 |
| Capital costs – sustaining | $189 | $28.43 |
| AISC | $1,314 | $197.88 |
Capital Cost Estimates
The basis of the PFS capital cost estimate included capacity sufficient for an expansion in processing throughput up to 1,000 stpd after the initial production startup.
Cost estimates are based on the Company’s in-house database of operations, projects, and prior studies, as well as budgetary quotations from mining contractor and mine equipment suppliers. GRES prepared the capital estimates for the re-build of the process plant. Apart from the primary grinding mill, process plant estimates are based on new equipment pricing. However, the Company intends to utilize a combination of new and refurbished equipment to optimize capital costs while minimizing the risk of cost overruns.
Pre-production capital includes mine refurbishment and underground development activities, including the establishment of a planned three-month ore stockpile to support smooth commissioning and ramp-up of the new milling complex. Two planned phases of expansions of the tailings facility have been accounted for in the sustaining capital period.
A summary of the initial and sustaining capital costs over the LOM are shown below.
Table 6 – Capital Cost Summary
| Capital Costs ($millions) | Initial | Sustaining | Total LOM |
| Underground Mine – Infrastructure | $9.2 | $50.1 | $59.3 |
| Underground Mine – Development | $21.1 | $10.8 | $32.0 |
| Tailings Management Facility | $0.0 | $4.9 | $4.9 |
| Mineral Processing Plant | $16.9 | $0.0 | $16.9 |
| On-Site Infrastructure | $1.0 | $0.0 | $1.0 |
| Total Direct Costs | $48.3 | $65.8 | $114.1 |
| Owner Costs and Reclamation | $0.0 | $5.0 | $5.0 |
| Project Indirect Costs | $4.1 | $0.0 | $4.2 |
| Contingency | $5.9 | $6.1 | $12.0 |
| Total Indirect Costs | $10.1 | $11.1 | $21.2 |
| Grand Total | $58.4 | $76.9 | $135.3 |
Construction Decision and Next Steps
As a result of the Copperstone PFS results showing a robust, high-return underground gold project, the Company’s Board of Directors has made a positive formal construction decision. The construction period is expected to last approximately one year, with initial production anticipated by mid-2027.
Pre-construction activities commenced earlier this year, with select major process plant components having been delivered to the project site in recent weeks. Mobilization of an underground mining contractor is expected to occur in the coming 2-3 months. Benefitting from over 4 km of existing underground development, the overall goals for underground work this year will be to rehabilitate areas where required, access new stoping areas, and establish all underground infrastructure required for mining operations.
Recommendations
-
The Copperstone project has an extensive history of both open pit and underground mining. For the purposes of the Copperstone PFS, only underground accessible Resources were considered. A portion of these Resources exist in near-surface areas in proximity to the historic open pit excavations (“Open Pit Potential”). The Company believes there is potential for gold mineralization to be extracted via open pit mining methods which would allow for the consideration of reduced cut-off grades. This opportunity will be more fully evaluated over the course of 2026 and 2027.
-
Additional mine development optimization is ongoing to look at opportunities to delay some of the mine preproduction activities for completion after the start of production. In addition, studies continue to evaluate potential updates to mine stope sequencing and different cut-off grades to maximize gold production throughout the mine plan.
-
Follow-up underground in-fill drilling is planned to commence once operations are underway to support mine planning and sequencing and will also target future Resource expansions.
Non-IFRS Measures. This news release refers to certain financial measures, such as cash costs and all-in-sustaining costs, which are not measures recognized under IFRS and do not have a standardized meaning prescribed by IFRS. These measures may differ from those used by other companies and, accordingly, may not be comparable to such measures as reported by other companies. These measures have been derived from the Company’s financial statements because the Company believes that they are of assistance in understanding the results of operations and its financial position. Certain additional disclosures for these specified financial measures have been incorporated by reference and can be found in the Company’s MD&A, available on SEDAR+.
Total cash costs. The Company uses total cash costs per gold ounce sold to monitor its operating performance internally. The most directly comparable measure prepared in accordance with IFRS is cost of sales. The Company believes this measure provides investors and analysts with useful information about its underlying total cash costs of operations. The Company also believes it is a relevant metric used to understand its operating profitability and ability to generate cash flow. Total cash costs are measures developed by metals companies in an effort to provide a comparable standard; however, there can be no assurance that the Company’s reporting of these non-GAAP financial measures are similar to those reported by other mining companies. They are widely reported in the metals mining industry as a benchmark for performance, but do not have a standardized meaning and are disclosed in addition to IFRS measures. Total cash costs include production costs, refinery and transportation costs, royalties and production taxes. Total cash costs exclude non-cash depreciation and depletion and site share-based compensation. Production costs include mining, crushing, processing, and direct overhead at the operation sites.
AISC. AISC more fully defines the total costs associated with producing precious metals. The AISC is calculated based on guidelines published by the World Gold Council (WGC), which were first issued in 2013. In light of new accounting standards and to support further consistency of application, the WGC published an updated Guidance Note in 2018. Other companies may calculate this measure differently because of differences in underlying principles and policies applied. Differences may also arise due to a different definition of sustaining versus growth capital. Note that in respect of AISC metrics within the technical reports, because such economics are disclosed at the project level, corporate general and administrative expenses were not included in the AISC calculations. AISC per ounce includes mining, processing, direct overhead, reclamation and sustaining capital.
Qualified Persons and NI 43-101 Technical Report
The scientific and technical information contained in this news release has been reviewed and approved by Darren Koningen, P.Eng., President and COO of the Company, who is a “Qualified Person” (“QP”) as defined under National Instrument 43-101 – Standards of Disclosure for Mineral Projects (“NI 43-101”). Mr. Koningen is not considered independent within the meaning of NI 43-101.
The Copperstone PFS referenced in this news release was prepared by the Company with contributions from, and review by, Independent Qualified Persons as defined by NI 43-101. The PFS will be supported by a NI 43-101 technical report, which the Company expects to file under its profile on SEDAR+ and on the Company’s website within 45 days of the date of this news release.
The following independent Qualified Persons were responsible for preparing or supervising the preparation of the scientific and technical information contained in the Copperstone Project technical report and have reviewed and approved the corresponding disclosure contained in this news release:
- Peter Szkilnyk, P.Eng., Rockpoint Advisory
- Scott Zelligan, P.Geo., Zelligan Consulting Inc.
- Garth Wilcox, P.Eng.
- Lawrence Segerstrom, M.Sc., CPG, Segerstrom Consulting LLC
- Alex Duggan, P.Eng.
- GR Engineering Services Inc.
The Qualified Persons have verified the data disclosed herein in accordance with industry-standard practices and have determined that the data, assumptions, and methodologies used are appropriate for the purposes of the technical report and this news release. A description of the data verification procedures and quality assurance/quality control measures will be included in the applicable sections of the NI 43-101 technical report.
Cautionary Note to U.S. Investors Regarding Mineral Resources and Mineral Reserves
Mineral Resources that are not Mineral Reserves do not have demonstrated economic viability, and U.S. investors are cautioned that terms such as “Measured,” “Indicated” and “Inferred Mineral Resource” are recognized and required by Canadian regulations but may not be comparable to similar terms used in U.S. reporting standards.
About Minera Alamos
Minera Alamos is a growing North American gold production and development company with projects in Nevada, Arizona, and Mexico. The Company owns the Pan Operating Complex in White Pine County, Nevada, comprised of the producing Pan mine and the adjacent permitted Gold Rock project, as well as the nearby past-producing Illipah project.
The Company also owns the Copperstone project in La Paz County, Arizona, a permitted, advanced underground gold project. The Company maintains a portfolio of high-quality Mexican assets, including the Cerro de Oro project, an open pit heap leach gold development project in northern Zacatecas.
The Company’s strategy is to become a leading, U.S.-focused intermediate gold producer by growing production at its Pan Operating Complex and developing its pipeline of high-quality, low-capital projects while expanding gold resources across its portfolio.
The Company announced a proposed name change to Mining Americas Inc., subject to the approval of its shareholders at the Company’s Annual General Meeting to be held on June 25, 2026 and the TSX Venture Exchange. Refer to the Company’s news release dated May 11, 2026 for more details.
For Further Information, Please Contact:
Darren Blasutti, CEO
416-306-0990 ext 208
[email protected]
David Stewart, VP Corporate Development & Capital Markets
647-294-8361
[email protected]
Website: www.mineraalamos.com
Caution Regarding Forward-Looking Statements
This press release includes certain “forward-looking information” within the meaning of applicable Canadian securities legislation. All information herein, other than information of historical fact, constitutes forward-looking information. Forward-looking information is frequently, but not always, identified by words such as “expects”, “anticipates”, “believes”, “intends”, “estimates”, “potential”, “possible”, and similar expressions, or statements that events, conditions, or results “will”, “may”, “could”, or “should” occur or be achieved. In this news release, forward-looking statements relate to, among other things, statements regarding: the Project and the estimation of its mineral resources and reserves, the development, operational and economic results of the PFS , including cash flows, revenue potential, development, expenditures, and timing thereof, extraction rates, LOM projections and cost estimates, timing of completion of a technical report summarizing the results of the PFS, estimates of metallurgical recovery rates, and anticipated advancement of the Project. This information is based on information currently available to the Company and the Company provides no assurance that actual results will meet management’s expectations.
The forward-looking information is based on assumptions and addresses future events and conditions that, by their very nature involve inherent risks and uncertainties. Actual results could differ materially from those currently anticipated in forward-looking information for many reasons. The Company’s financial condition and prospects could differ materially from those currently anticipated in forward-looking information for many reasons such as: an inability to receive requisite permits for mine operation, exploration or expansion; an inability to finance and/or complete updated resource and reserve estimates and technical reports which support the technical and economic viability of mineral production; changes in general economic conditions and conditions in the financial markets; changes in demand and prices for minerals; litigation, legislative, environmental and other judicial, regulatory, political and competitive developments; technological and operational difficulties encountered in connection with the Company’s activities; and other matters discussed in this press release and in filings made with securities regulators. This list is not exhaustive of the factors that may affect any of the Company’s forward-looking information. These and other factors should be considered carefully, and readers should not place undue reliance on the Company’s forward-looking information. The Company does not undertake to update any forward-looking information that may be made from time to time by the Company or on its behalf, except in accordance with applicable securities laws.
NEITHER TSX VENTURE EXCHANGE NOR ITS REGULATION SERVICES PROVIDER (AS THAT TERM IS DEFINED IN THE POLICIES OF THE TSX VENTURE EXCHANGE) ACCEPTS RESPONSIBILITY FOR THE ADEQUACY OR ACCURACY OF THIS RELEASE.

To view the source version of this press release, please visit https://www.newsfilecorp.com/release/299120