Montreal CMA: Adjustment Period Continues, Condominium Market in Balance
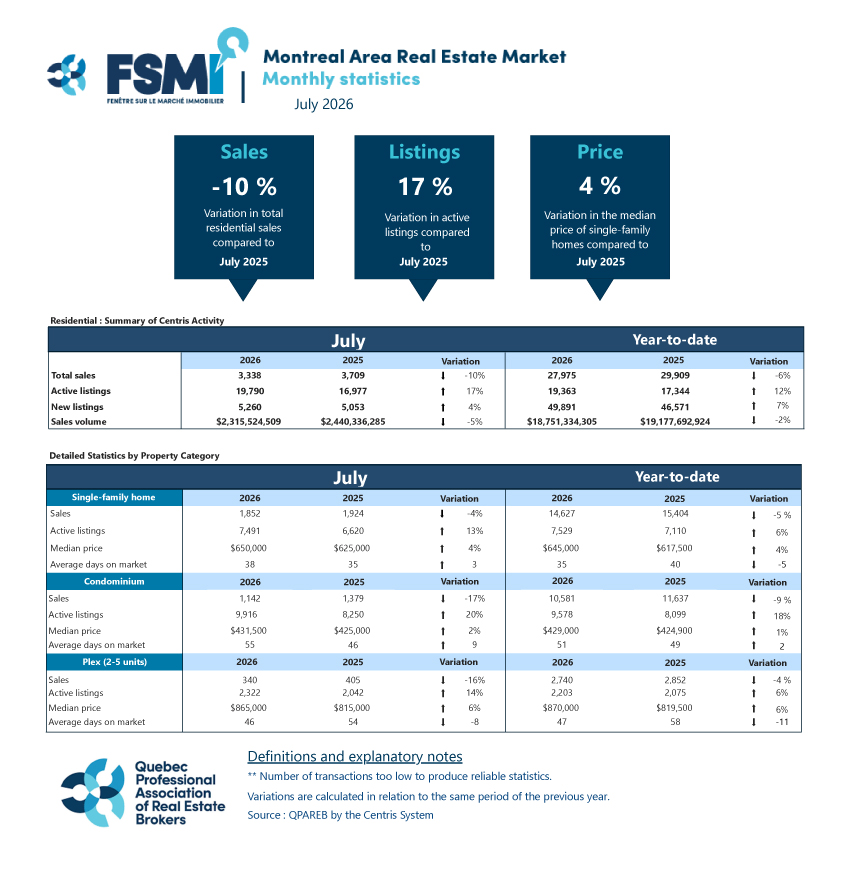
L’ÎLE-DES-SŒURS, Quebec, Aug. 06, 2026 (GLOBE NEWSWIRE) — The Quebec Professional Association of Real Estate Brokers (QPAREB) has just released its residential real estate market statistics for the month of July 2026. The most recent market statistics for the Montreal Census Metropolitan Area (CMA) are based on the real estate brokers’ Centris provincial database.
Highlights
- In July, 3,338 residential sales were completed through the Centris system, marking the fifth consecutive monthly decline and the steepest drop since February 2026.
- Last month’s slowdown extended across the entire market. All property categories and all large geographic sectors of the CMA recorded a decrease in sales compared with July 2025.
- The supply of properties for sale continued the rebound that began in summer 2025. With 19,790 active listings, inventory rose by 17 per cent from the previous year and is now 9 per cent above its historical average for July.
- Condominiums posted the strongest increase in supply (+20 per cent), ahead of plexes (+14 per cent) and single-family homes (+13 per cent).
- Rising supply and slowing demand are reinforcing the market easing observed over the past several months. Even so, sellers of single-family homes and plexes continue to hold a clear advantage in negotiations.
- The condominium market on the Island of Montreal stands apart, with balanced conditions that have persisted for several months. Most areas of the island still face limited inventory, although Ville-Marie and Centre remain in surplus.
- Despite this rebalancing, prices continued to rise. The median price of single-family homes increased by 4 per cent from the previous year, plexes by 6 per cent and condominiums by 2 per cent.
- In this less buoyant market, selling times lengthened for most properties. Single-family homes sold in an average of 38 days (+3 days) and condominiums in 55 days (+9 days). Plexes were the exception, with the average selling time down by 8 days to 46 days.
July’s results continued the trend observed in previous months. The Montreal CMA residential market remains in an adjustment phase, with conditions easing more quickly in the condominium segment. Sales in this category are declining more sharply than for single-family homes, while the number of properties available for sale continues to rise.
“Condominium inventory initially rose rapidly in the central neighbourhoods of the Island of Montreal, where it has now reached levels well above those seen in recent years. This growth, however, is beginning to moderate in these areas. Supply is now increasing more quickly in the island’s less central neighbourhoods, as well as on the South Shore, in Laval and on the North Shore,” states Camille Laberge, Assistant Director of the QPAREB Market Analysis Department.
“Although the existing condominium market is adjusting more quickly, single-family homes and plexes are also seeing lower sales and higher supply. This broad-based slowdown in Greater Montreal’s residential real estate market is unfolding in a fragile economic environment and alongside a demographic shift. Stricter immigration rules are now contributing to a decline in the population of the Montreal CMA, which inevitably tempers demand across housing types,” explains Hélène Bégin, QPAREB Senior Economist.
| Growth in Condominium Supply by CMA Area – July 2026 | ||||
| Area | Sector | Active Listings | Annual Variation | |
| South West | South Shore | 75 | 168 | % |
| Sainte-Julie/Varennes | South Shore | 88 | 138 | % |
| Beloeil/Mont-Saint-Hilaire | South Shore | 104 | 100 | % |
| Repentigny | North Shore of Montreal | 126 | 94 | % |
| Montreal-Nord | Island of Montreal | 54 | 93 | % |
| Saint-Jérôme | North Shore of Montreal | 107 | 88 | % |
| North Shore (West) | North Shore of Montreal | 87 | 78 | % |
| Candiac/La Prairie | South Shore of Montreal | 146 | 72 | % |
| Blainville | North Shore of Montreal | 81 | 65 | % |
| Saint-Hubert | South Shore of Montreal | 134 | 60 | % |
| Eastern Tip of the Island | Island of Montreal | 139 | 53 | % |
| Mascouche | North Shore of Montreal | 86 | 48 | % |
| Ahuntsic | Island of Montreal | 211 | 48 | % |
| Mercier/Hochelaga-Maisonneuve | Island of Montreal | 298 | 48 | % |
| Rosemont | Island of Montreal | 235 | 45 | % |
| Sainte-Rose/Auteuil/Vimont | Laval | 58 | 45 | % |
| West Island South | Island of Montreal | 183 | 39 | % |
| Vieux-Longueuil | South Shore of Montreal | 245 | 38 | % |
| Lachine/LaSalle | Island of Montreal | 319 | 32 | % |
| NDG/Montreal-Ouest | Island of Montreal | 157 | 31 | % |
| Le Plateau-Mont-Royal | Island of Montreal | 348 | 30 | % |
| Anjou/Saint-Léonard | Island of Montreal | 137 | 29 | % |
| CDN/CSL | Island of Montreal | 339 | 28 | % |
| Terrebonne | North Shore of Montreal | 113 | 26 | % |
| Saint-Laurent | Island of Montreal | 354 | 22 | % |
| Chambly | South Shore of Montreal | 58 | 18 | % |
| West Island North | Island of Montreal | 187 | 18 | % |
| South West | Island of Montreal | 842 | 17 | % |
| Brossard/Saint-Lambert | South Shore of Montreal | 511 | 12 | % |
| Mirabel | North Shore of Montreal | 80 | 10 | % |
| Boisbriand/Sainte-Thérèse | North Shore of Montreal | 72 | 9 | % |
| Villeray | Island of Montreal | 116 | 8 | % |
| Centre | Island of Montreal | 286 | 6 | % |
| Downtown Laval | Laval | 403 | 5 | % |
| Nuns’ Island | Island of Montreal | 292 | 4 | % |
| Ville-Marie | Island of Montreal | 2,303 | 2 | % |
| Vaudreuil-Dorion | Vaudreuil-Soulanges | 106 | 1 | % |
| L’Île-Perrot | Vaudreuil-Soulanges | 62 | 0 | % |
Additional Information:
Detailed and Cumulative Monthly Statistics for the Province and Regions
If you would like additional information from the Market Analysis Department, such as specific data or regional details on the real estate market, please write to us.
About the Quebec Professional Association of Real Estate Brokers
The Quebec Professional Association of Real Estate Brokers (QPAREB) is a non-profit association that brings together more than 15,000 real estate brokers and agencies. It is responsible for promoting and defending their interests while taking into account the issues facing the profession and the various professional and regional realities of its members. The QPAREB is also an important player in many real estate dossiers, including the implementation of measures that promote homeownership. The Association reports on Quebec’s residential real estate market statistics, provides training, tools and services relating to real estate, and facilitates the collection, dissemination and exchange of information. The QPAREB has its head office in Quebec City, administrative offices in Montreal and a regional office in Saguenay. It has two subsidiaries: Société Centris inc. and the Collège de l’immobilier du Québec. Follow its activities at qpareb.ca or via its social media pages: Facebook, LinkedIn, and Instagram.
For more information:
Ariane Boulé
Morin Relations Publiques
[email protected]
Banque d’images (crédit APCIQ) disponible et sans frais.
A photo accompanying this announcement is available at https://www.globenewswire.com/NewsRoom/AttachmentNg/b5b051c9-9d31-43b3-b492-6a8429ec5123